As Bitcoin’s recent price pullback continues to weigh on the broader altcoin market, Hedera’s native token HBAR has dropped nearly 20% over the past seven days.
On the daily chart, the token hovers dangerously close to breaching a key support level, raising concerns of a deeper correction. However, not all signals are bearish. On-chain data flashes two encouraging signs that could hint at a potential reversal.
Hedera’s HBAR Faces Breakdown
Readings from the HBAR/USD one-day chart show the altcoin trading near its 20-day exponential moving average (EMA). With climbing sell-side pressure, a breach below this key support floor formed at $0.22 appears likely over the next few trading sessions.
For token TA and market updates: Want more token insights like this? Sign up for Editor Harsh Notariya’s Daily Crypto Newsletter here.
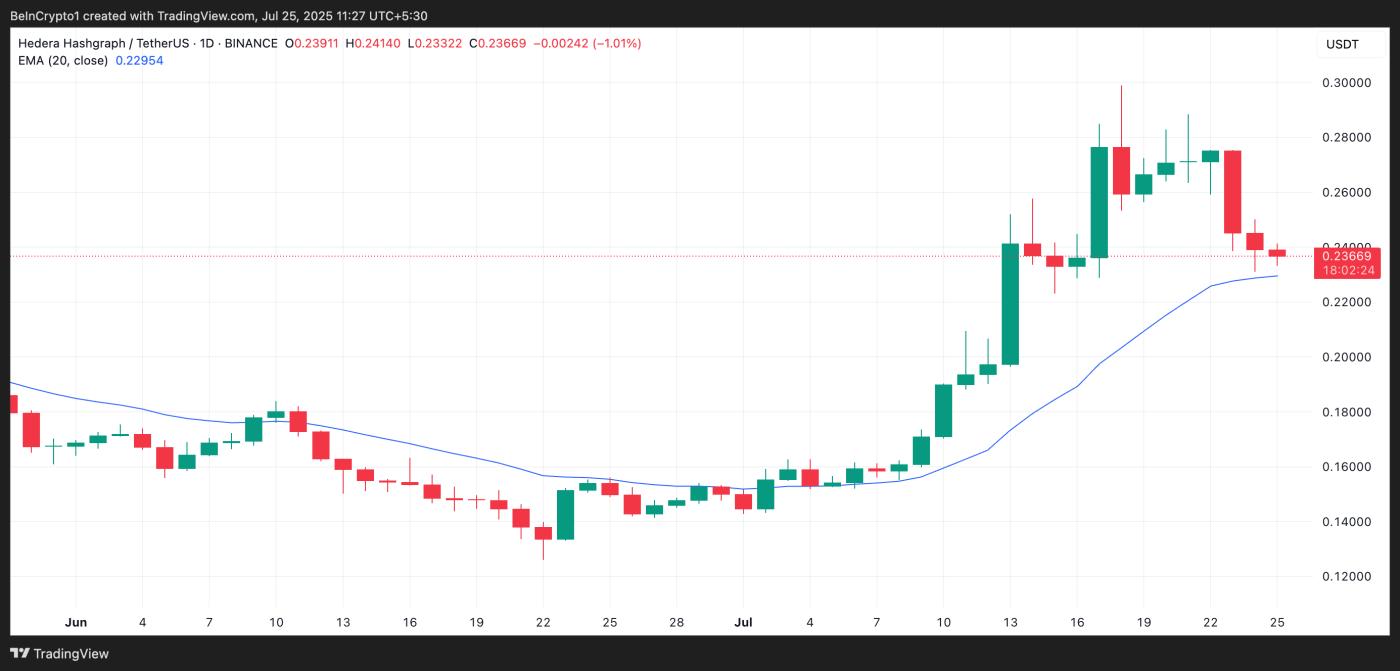 HBAR 20-Day EMA. Source: TradingView
The 20-day EMA measures an asset’s average price over the past 20 trading days, giving weight to recent prices. It is a widely used technical indicator that smooths out recent price action to help identify trends.
When an asset’s price is poised to break below this support level, its short-term momentum is weakening.
If the price falls below this line, especially after an extended uptrend, it signals a potential shift from bullish to bearish sentiment. This setup often triggers further selling as traders interpret it as a loss of short-term support.
HBAR Slides, Yet Bulls Hold the Line
However, not all signals are bearish. Some on-chain data suggests a potential reversal may be underway. First, HBAR’s liquidation heatmap shows a notable liquidity cluster around $0.29, per Coinglass data.
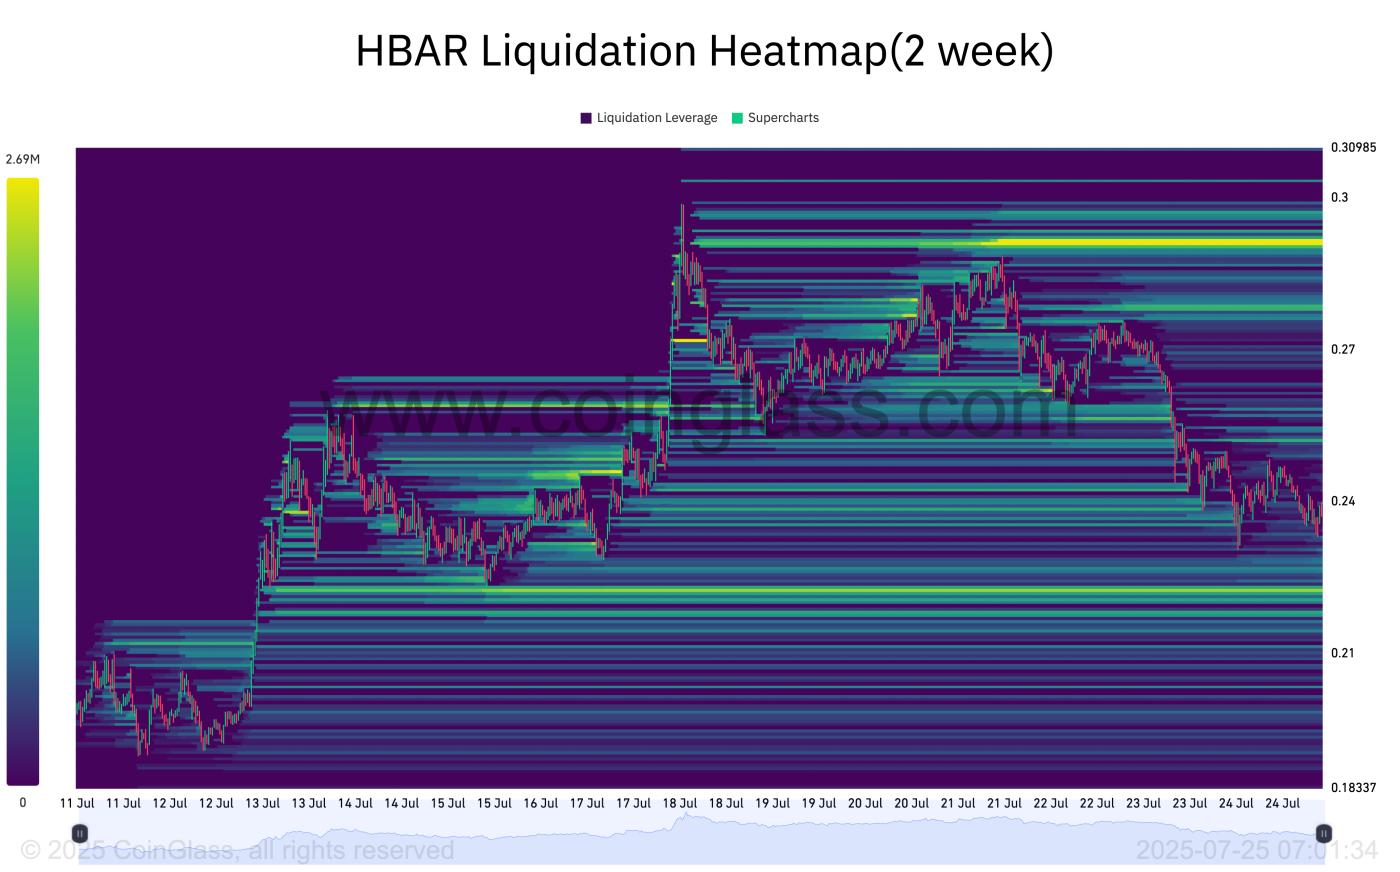 HBAR Liquidation Heatmap. Source: Coinglass
Liquidation heatmaps identify price zones where clusters of leveraged positions are likely to be liquidated. These maps highlight areas of high liquidity, often color-coded to show intensity, with brighter zones (yellow) representing larger liquidation potential.
When capital clusters form above an asset’s current market price, they often attract upward price movement. Traders target these zones to trigger stop-losses or liquidations, creating short-term bullish pressure.
For HBAR, this liquidity cluster around $0.29 could act as a price magnet, drawing the asset higher as the market moves to tap into that pool of orders.
Furthermore, HBAR’s funding rate has remained positive despite its price’s lackluster performance over the past few days. As of this writing, this is at 0.0092%, indicating the preference for long positions among futures market participants.
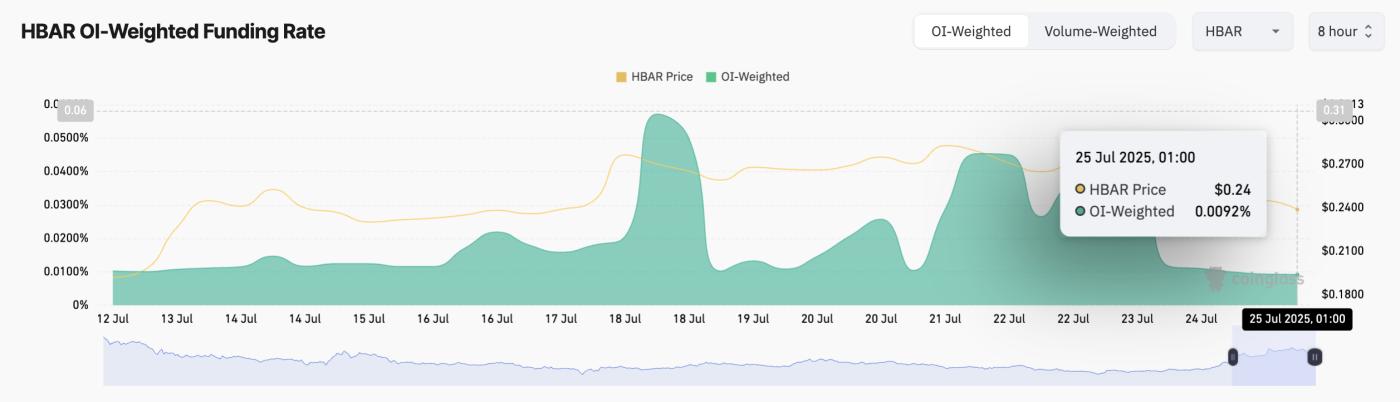 HBAR Funding Rate. Source: Coinglass
The funding rate is a periodic fee paid between long and short traders in perpetual futures markets to keep the contract price in line with the spot price. When it is positive, more traders are betting on the asset’s price to rise, and longs are paying shorts to maintain their positions.
HBAR’s consistently positive funding rate, even during its recent dip, signals lingering bullish sentiment among traders. It hints at potential upward momentum once market conditions stabilize.
HBAR’s Fate Hangs on 20-Day EMA at $0.22
Improvements in broader market sentiment could strengthen the dynamic support formed by HBAR’s 20-day EMA at $0.22. If this level holds, it may act as a launchpad for a short-term rebound toward the $0.26 mark.
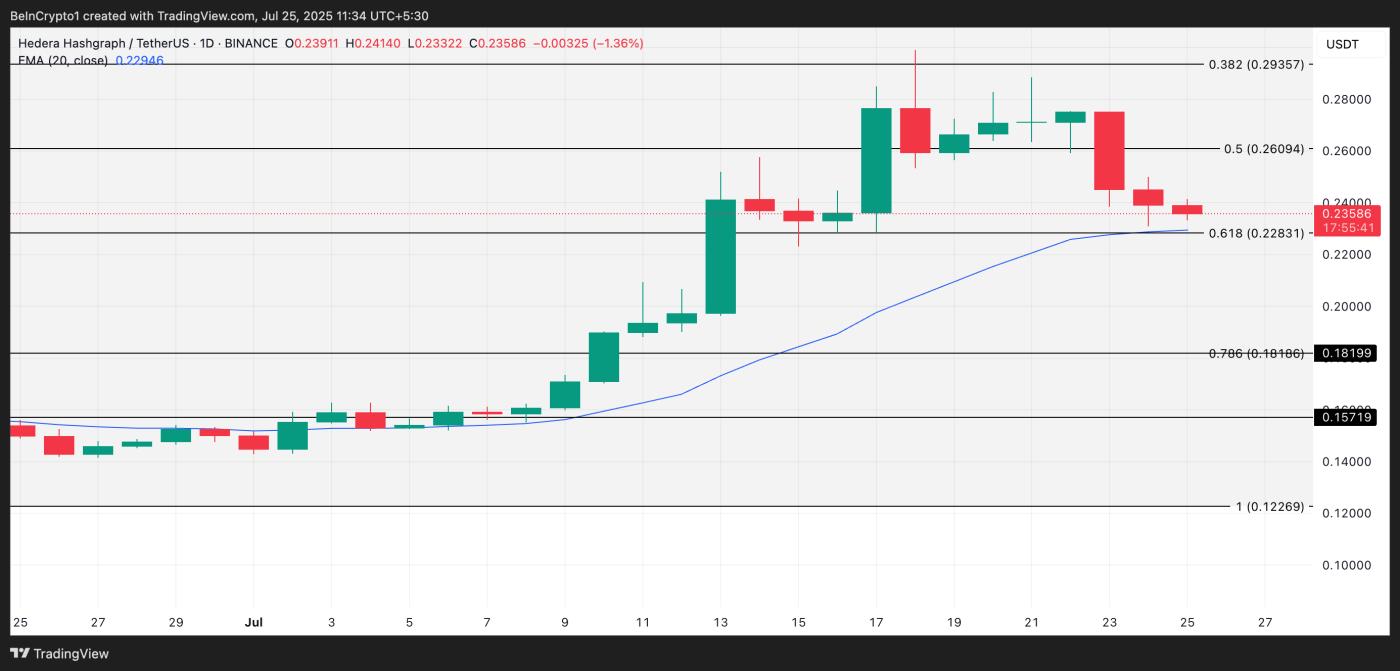 HBAR Price Analysis. Source: TradingView
However, a decisive break below this support zone could expose HBAR to further downside, potentially dragging the price as low as $0.18.