Bitcoin is facing a challenging period. BTC price has dropped around 6% from its All-Time-High of approximately 123,000 USD.
While retail investors hope for a price recovery, on-chain signals suggest there might be deeper issues. Both whales and institutions seem to be retreating, and the chart looks unfavorable.
Whale Activity Paints a Bearish Picture
BTC price has now dropped 6% from its ATH of 122,838 USD. This decline may not be coincidental.
In the past 10 days, the number of whale addresses holding 1,000 to 10,000 BTC has decreased from 2,037 to 1,982 — a 2.7% drop. This is the most significant decline in whale participation in over six months.
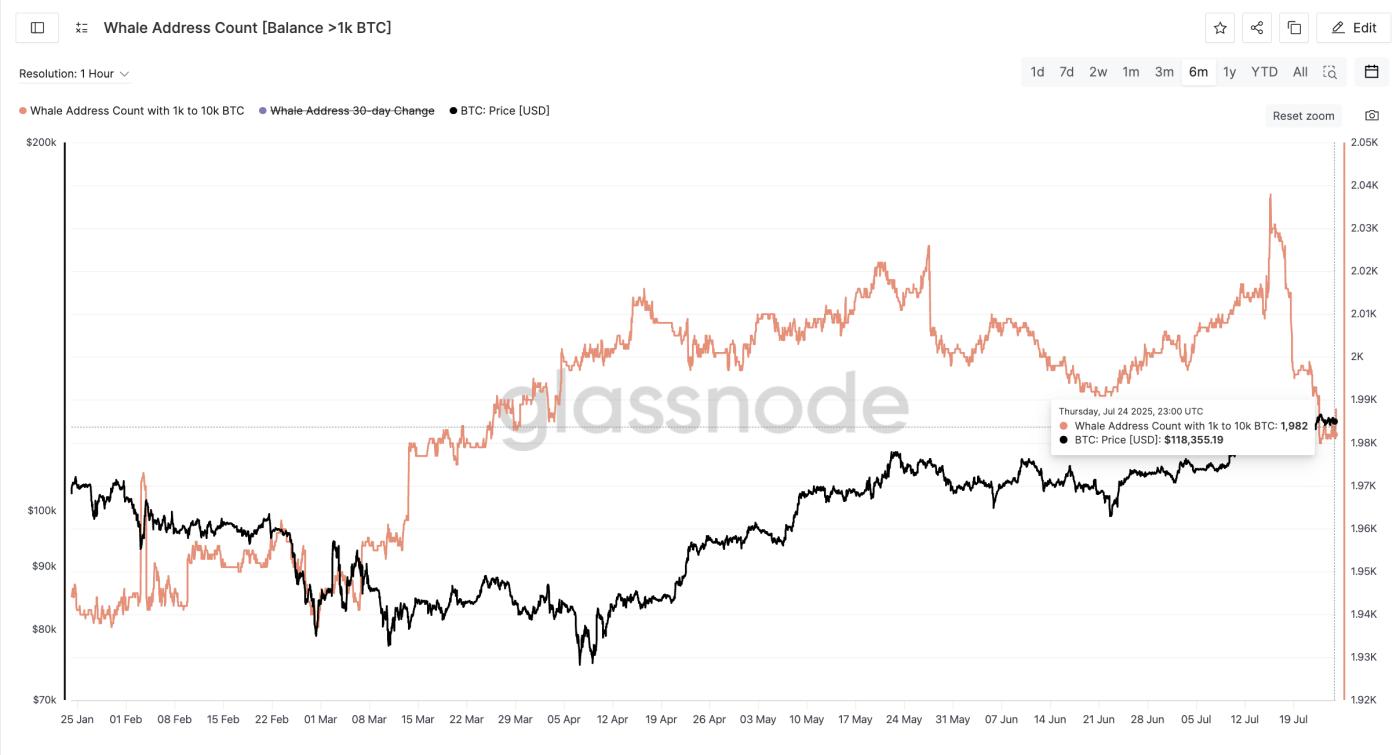 Bitcoin Price and Whale Address Count: glassnode
It's not just the number of wallets that matters. The whale ratio on exchanges, an indicator showing how much inflow to exchanges comes from whales, is also increasing.
Historically, this ratio created three consecutive lower peaks on 04, 08, and 13/07. This coincided with BTC price reaching its All-Time-High. Currently, we're seeing higher peaks. The ratio was 0.5 on 22/07, rising to 0.52 on 24/07, just as BTC price began to decline.
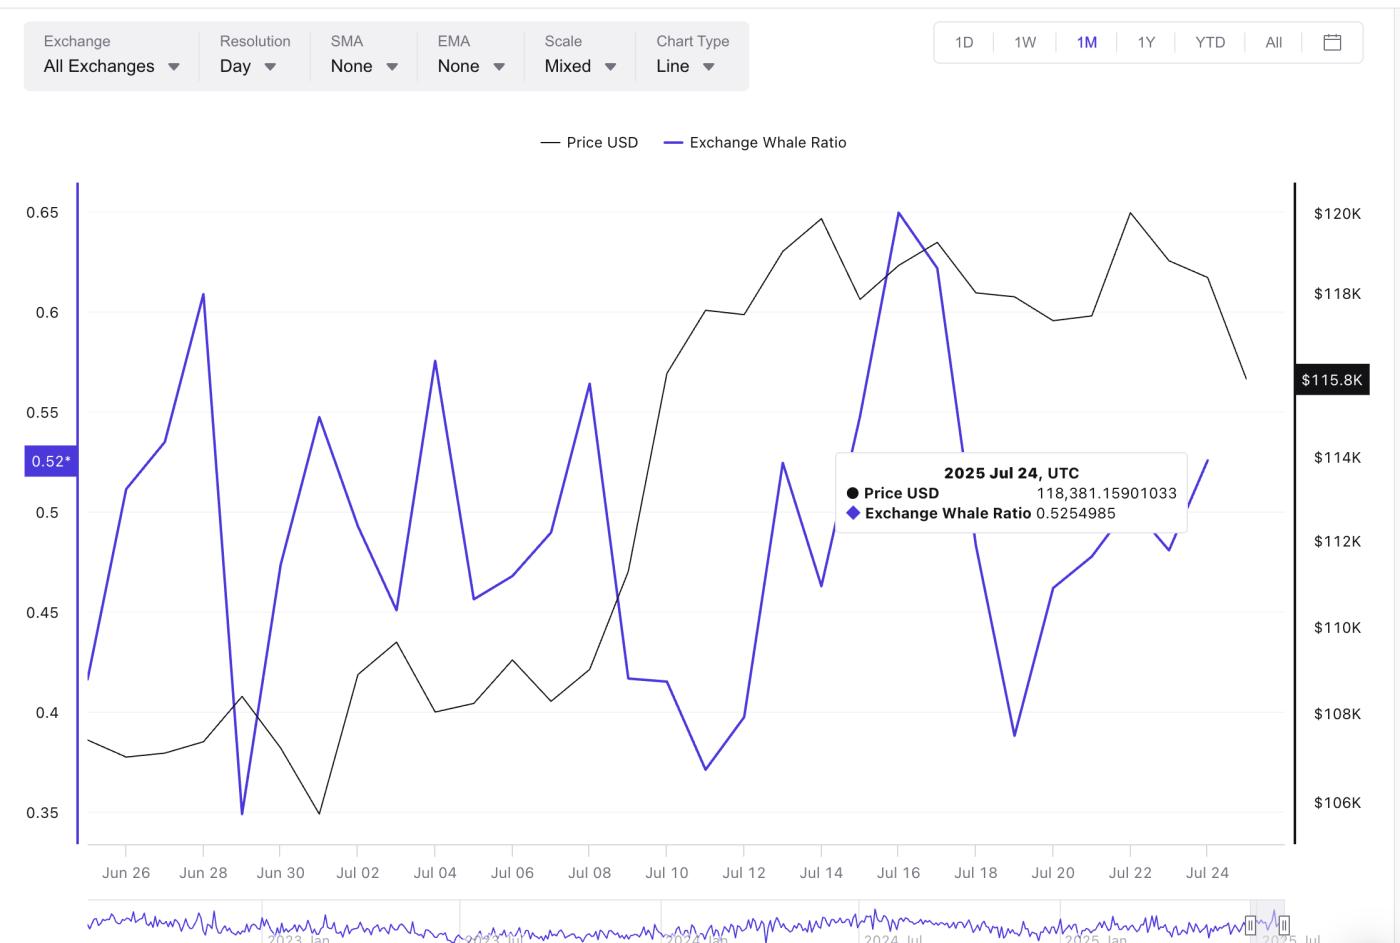 Bitcoin Price and Whale Ratio on Exchanges: Cryptoquant
This pattern suggests whales are not just retreating — they're sending coins to exchanges. If history repeats, selling pressure could increase. Galaxy Digital is reportedly said to have sent 10,000 BTC to exchanges earlier, adding to institutional concerns.
Bearish EMA Setup Signals Potential Collapse
The weakness caused by whales is now appearing on the 4-hour chart. Smaller time frames are typically used to identify early trends.
BTC price has just broken below the 100-period EMA (exponential moving average), an important short-term support. Worse, the 20-period EMA (red line) is on track to cross below the 50-period EMA (orange line), suggesting a bearish "death" crossover.
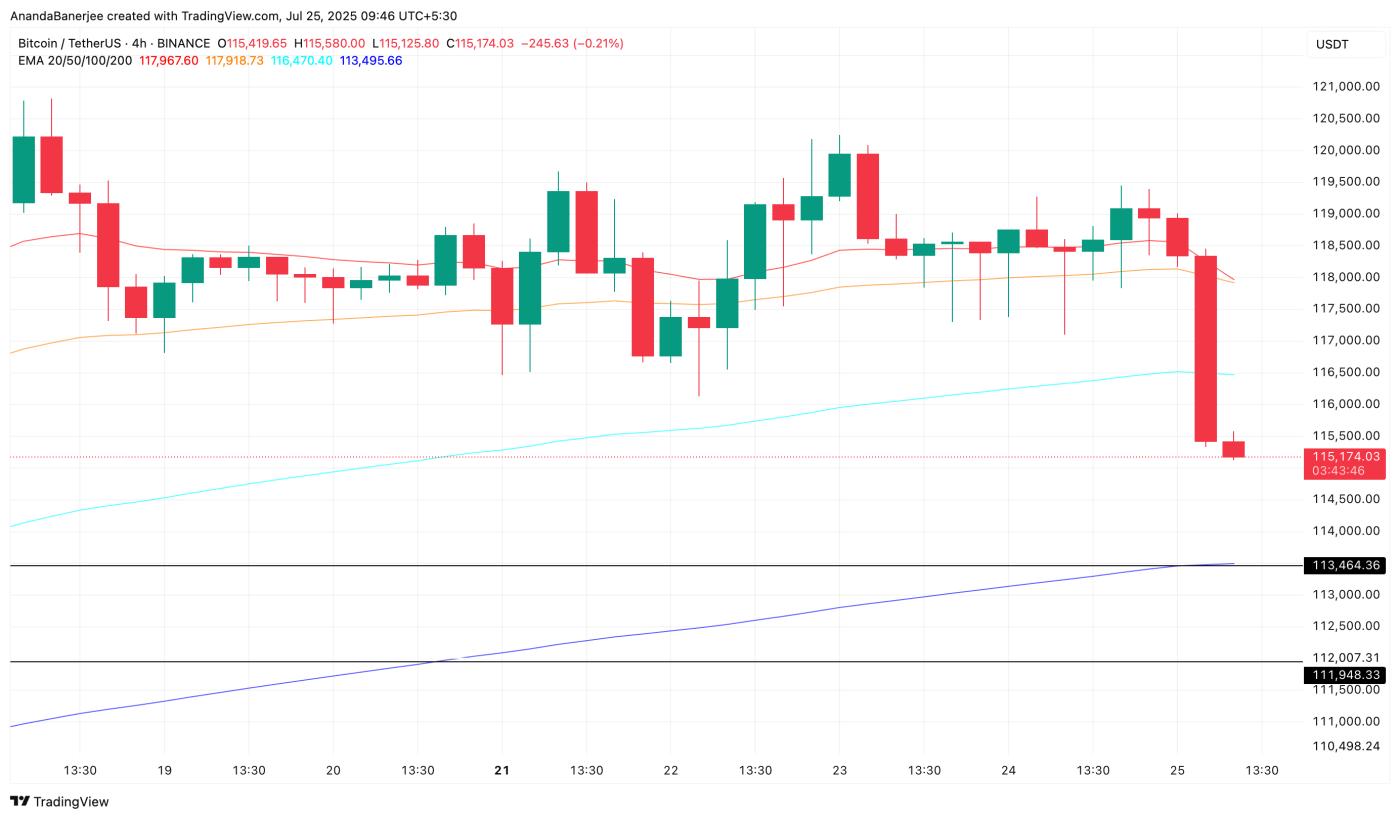 A Bearish Crossover Awaits: TradingView
Why is this important? These EMA levels often act as momentum signals for traders. A bearish crossover between EMA 20 and 50 typically confirms that short-term sellers are in control.
This aligns with whale outflows and large players like Galaxy quietly reducing their participation.
The next important support is the 200-period EMA (green line) on the 4-hour chart, currently near 113,000 USD. This EMA also aligns with a significant support level, to be revealed in the next section.
For TA and token updates: Want more detailed information about tokens like this? Subscribe to the Daily Crypto Newsletter by Editor Harsh Notariya here.
Bitcoin Price Chart Indicates 113,000 USD as Critical Defense Level
The daily Bitcoin price chart tells a similar story. After holding near 117,000 USD for almost a week, BTC has dropped sharply and is now hovering around 115,000 USD. If 113,000 USD doesn't hold, the next supports are at 110,000 USD and 107,000 USD: levels marked by 0.5 and 0.618 Fibonacci retracements.
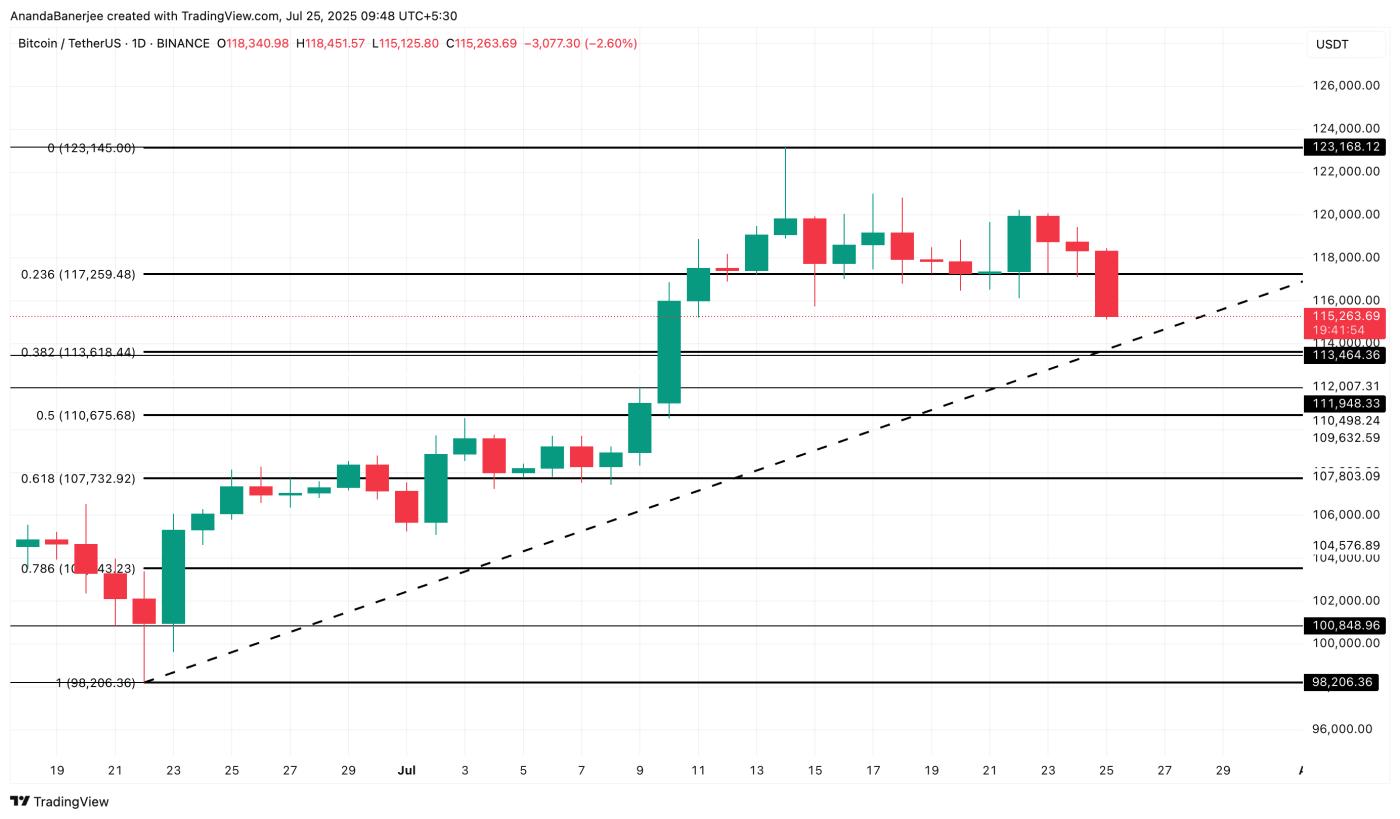 Bitcoin Price Analysis: TradingView
These are not random lines. They reflect the general trader psychology about corrections. If price breaks below 113,000 USD, BTC could face a deeper correction. Combined with bearish EMA patterns and increasing whale activity on exchanges, Bitcoin's collapse risk remains high.
However, if Bitcoin price can reclaim 117,000 USD and the previous All-Time-High near 123,000 USD, the bearish structure could soon be broken. Nevertheless, for that to happen, major Bitcoin space figures may need to return to the game.