While the broad cryptocurrency market is declining, Ethena (ENA) is going against the trend, increasing nearly 20% in the past 24 hours and attracting the attention of traders worldwide.
But what is truly outstanding is the convergence of important signals such as increased whale activity, stable outflow from exchanges, and charts showing an upward trend. All signs suggest something larger might be happening. Is ENA preparing for a price breakout?
Whales are Accumulating Ethena
The most important trend currently is whales buying, not selling. According to Nansen's dashboard, ENA whale holdings have increased 8.15% over the past seven days. At the current price, this is close to 1.87 million USD.
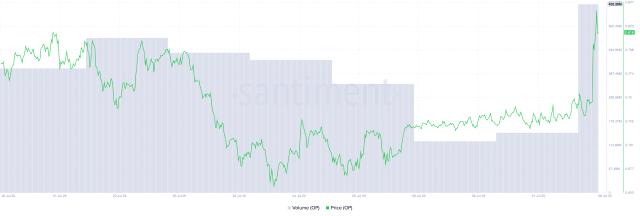
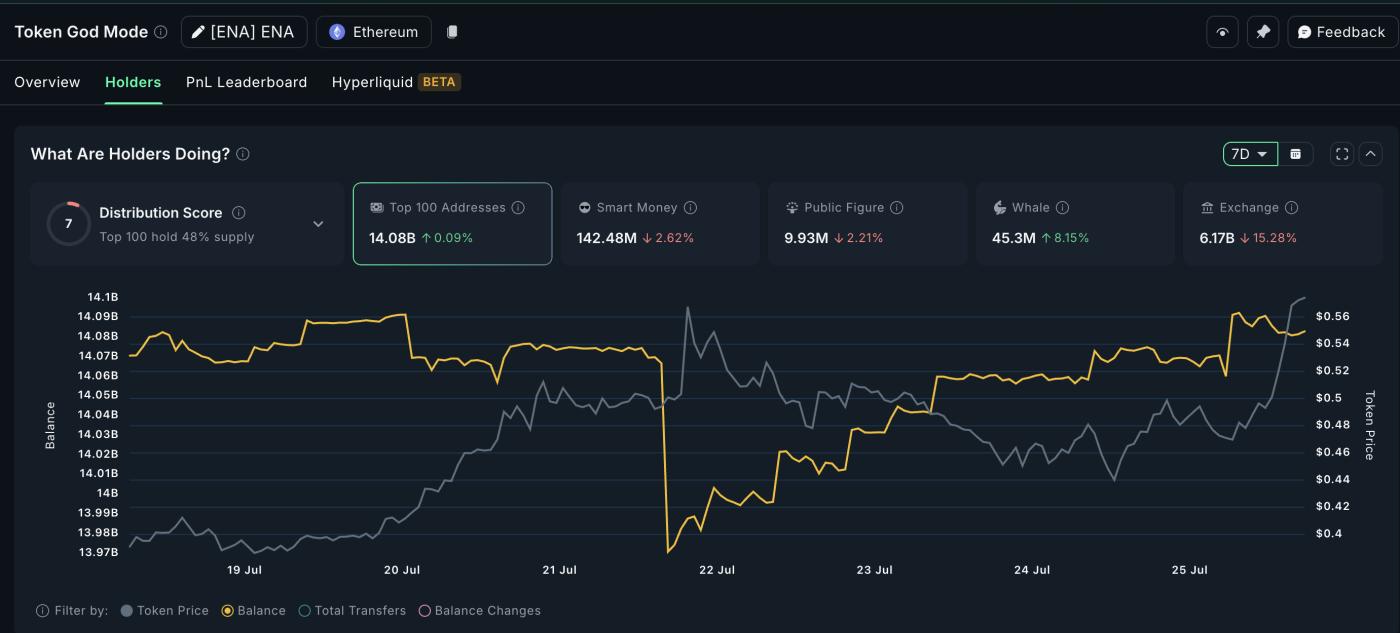 Ethena Price and Whale Accumulation Pattern: Nansen
This is a strong increase, happening while most of the market is stagnating or declining. Such whale behavior typically signals confidence; big players are positioning for a larger move.
Meanwhile, exchange balances are decreasing. In the past week, 1.07 billion ENA tokens have left exchanges.
This means Ethena (ENA) is moving into personal wallets, not trading platforms. When this happens, it usually indicates holders plan long-term retention. Less supply on exchanges means fewer opportunities for sudden selling.
In summary, large wallets are accumulating ENA, and the token is quietly disappearing from exchanges. This is a strong price increase setup.
OBV Divergence Suggests Momentum Building Underneath
The chart shows something more interesting. While ENA price creates lower peaks, the On-Balance Volume (OBV) creates higher peaks at the time of writing. This is called a price divergence; it occurs when volume flow shows stronger buying compared to price action.
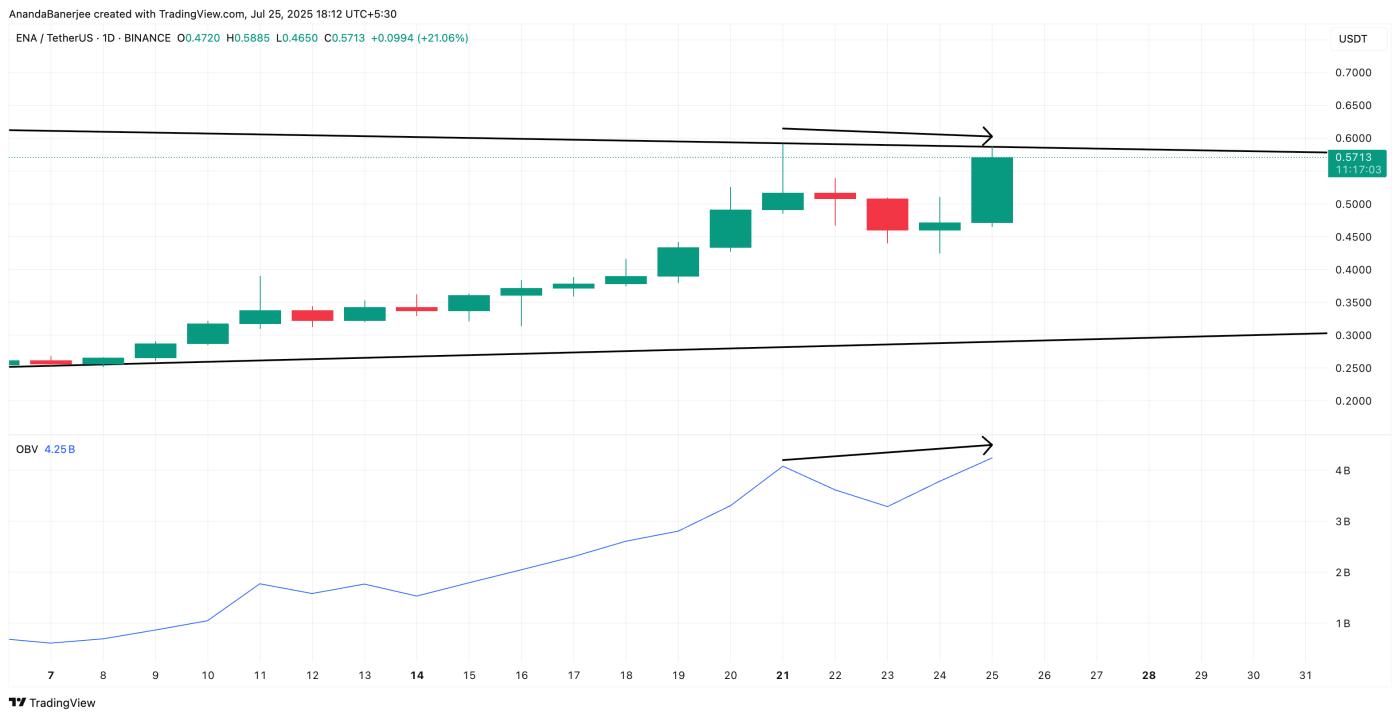 ENA Price and OBV Divergence: TradingView
At the time of writing, ENA remains in a converging wedge pattern and is trading near 0.57 USD. The OBV trend is breaking higher, suggesting buying pressure is increasing beneath the surface. Buyers are quietly entering even as the price consolidates.
This type of divergence often appears before a breakout. Combined with whale activity, it indicates accumulation may have begun.
On-Balance Volume (OBV) tracks whether volume is flowing into or out of a token, helping detect hidden trends.
For TA and token market updates: Want more detailed information about such tokens? Subscribe to the Daily Crypto Newsletter by Editor Harsh Notariya here.
Wedge Breakout Could Trigger Next Price Surge for ENA, but 0.60 USD is Key
Technically, ENA has been trading in a wedge pattern since late June. However, to add another confirmation layer, the chart uses a Fibonacci extension tool based on the trend. This tool or indicator is used to draw price targets in an upward trend.
The first point of the Fibonacci extension starts near 0.22 USD and extends to a recent peak around 0.59 USD. Yesterday, ENA corrected to 0.42 USD, but today it is bouncing back strongly and hovering just below the breakout zone.
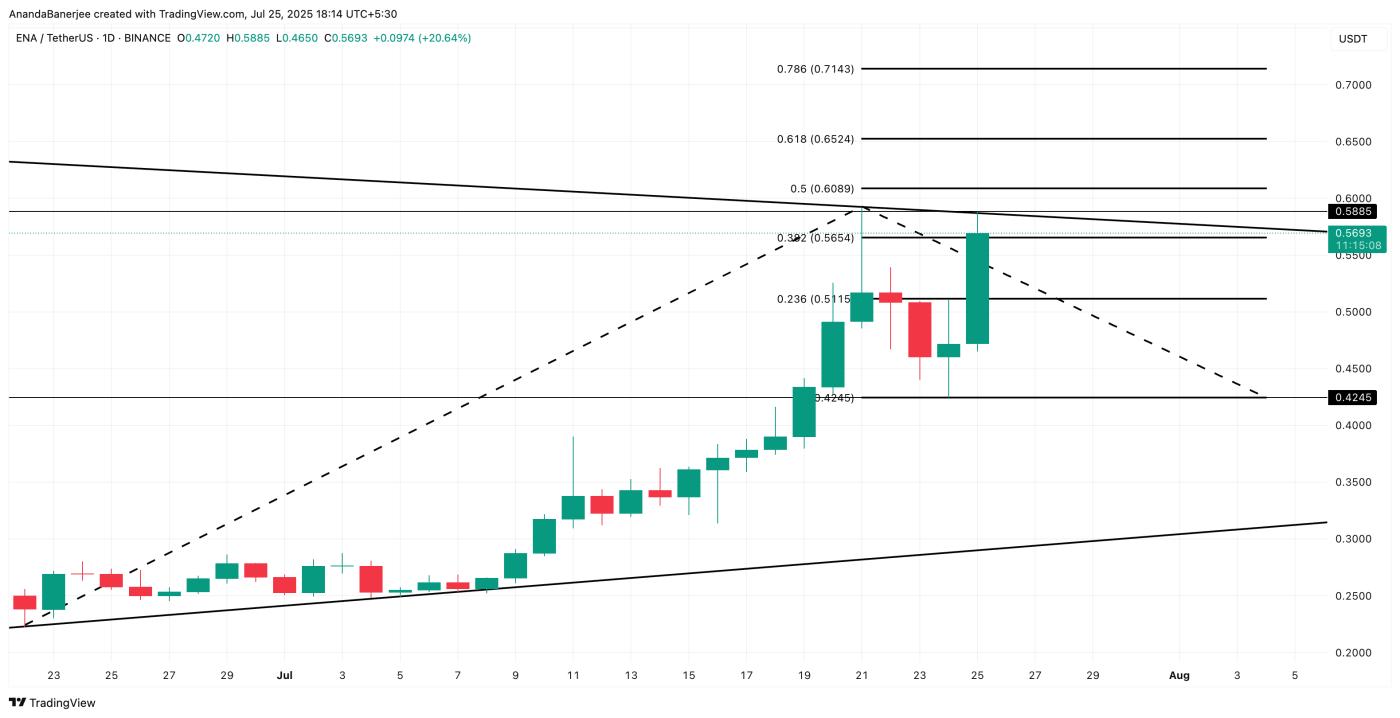 ENA Price Analysis: TradingView
The key number to watch now is 0.60 USD. This is the 0.5 Fibonacci extension from the recent trend. A clean breakout above the wedge at 0.58 USD, followed by the 0.60 USD mark, could open a price surge to 0.65 USD, 0.71 USD, or even higher. Especially with current support from whales and volume.
However, one thing to note. If ENA cannot break out and drops below 0.51 USD, the price surge scenario weakens. This would invalidate the wedge breakout argument and could trigger a correction.