Bitcoin (BTC) has failed to maintain its position above $120,000 in recent days, causing many short-term traders to take profits, leading to a price drop below $115,000 on Friday. Currently, it is oscillating around the key technical support level of $115,000, seemingly stuck in a dilemma.
VX: TZ7971
BTC's sideways trend is triggering a shift in investor sentiment, with growing interest in Ethereum (ETH), the second-largest cryptocurrency by market cap. Consequently, capital flows are beginning to change.
Data shows that in just the past six trading days, ETH spot ETF attracted $2.4 billion in net inflows, nearly three times the $827 million inflows into the Bitcoin ETF during the same period.
ETH's performance "may outperform Bitcoin in the next three to six months". If ETH breaks through the $4,000 mark, the market may enter a new "price discovery" phase.
What are the key support and resistance levels for BTC and ETH?
BTC Technical Analysis
BTC has fallen below the 20-day Simple Moving Average (SMA) of $116,305, indicating that bears are making a comeback.
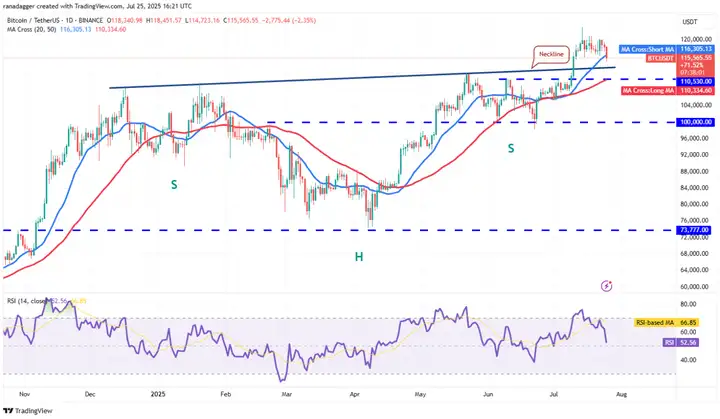
However, bulls are unlikely to give up easily. They will actively defend the area between the 20-day moving average and the $110,530 support level. A significant rebound from this support suggests market sentiment remains optimistic, with investors buying the dip. This increases the likelihood of BTC/USDT breaking through $123,218. If this occurs, it could surge to $135,729.
However, if the price continues to fall and breaks below $110,530, the bullish outlook will become invalid in the short term. This could trigger selling, dragging the price down to the important support level of $100,000.
ETH Technical Analysis
ETH faces strong bearish resistance pressure in the $3,850 area, but positively, bulls are holding their ground.
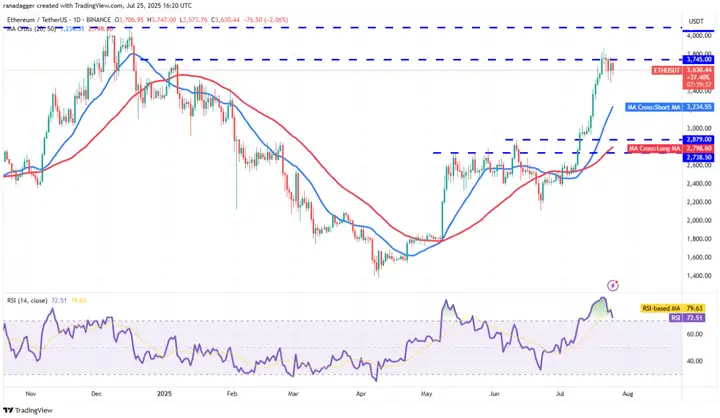
The price is consolidating narrowly below the strong resistance level, suggesting a high probability of breaking through. If it breaks, ETH/USDT may rise to challenge the upper resistance at $4,094. If it breaks and closes above this level, it could pave the way for further increases, with a target price of $4,868.
On the other hand, the first support level is at $3,500. If the price breaks and closes below this level, ETH may further drop to the 20-day moving average at $3,234. Bulls are expected to actively defend the 20-day moving average, as breaking below this level would give bears an advantage.
Today's fear index is 72, still in a greedy state.
The current market presents a typical "triple critical" high-pressure structure: futures short leverage at its peak, on-chain profit-taking accelerating, and whale selling pressure pending. Any single variable's mutation could break the current fragile balance and trigger a new market movement.
If effectively breaking below the $112,000 support level, it would confirm a short-term downward trend. If strongly breaking through the $118,000 resistance zone, it could trigger massive short-seller stop-loss closures, driving a rapid price increase.
Currently, it is not advisable to heavily bet on a single direction. Adjusting and repositioning during a pullback is the most stable strategy. A sudden macroeconomic positive, a whale's complete liquidation, or a concentrated liquidation could be the trigger for the next market movement.