The price of SHIB is underperforming while other meme coins are rising strongly. Dogecoin increased 29.8% in the past 30 days, BONK rose 20.4%, PENGU surged 151.1%, and even PEPE increased by over 9%. As for SHIB? Only 7.9%.
When the meme coin index increased 6.2% in the past 24 hours, SHIB is struggling in a narrow flag pattern, and the risk of breakdown is increasing.
Large holders continue to sell, and this is a warning sign
The net capital flow trend of large investors towards SHIB is clearly negative. In the past 30 days, "whales" have reduced their SHIB positions by over 181%. In the past 3 months, there has been no significant capital inflow.
Although negative net flow on exchanges usually means investors are not selling, in this case, the withdrawal of large wallets is more important, as they are likely heading to exchanges or other liquidation paths. The net capital flow of large investors turning negative is a bearish sign, unlike the net flow on exchanges turning negative. Simply put, they have opposite meanings.
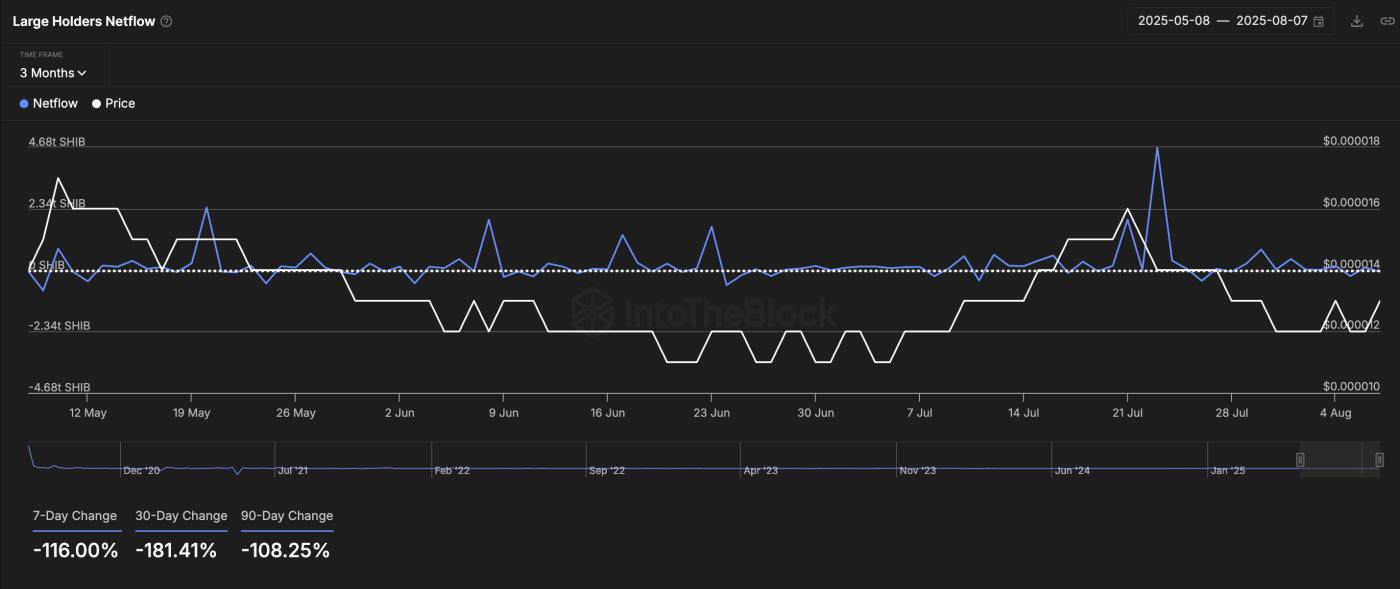 Shiba Inu price and net capital flow of large investors: IntoTheBlock
The current SHIB price index shows that "whales" are not accumulating or holding. Instead, they are reducing exposure. If this continues, it could lead to greater supply pressure in the future, especially if small retail investors also start to withdraw.
For TA and token updates: Want more detailed information about such tokens? Subscribe to the Daily Crypto Newsletter by Editor Harsh Notariya here.
Weak support clusters increase concerns about collapse
According to global in and out data, the current SHIB price range (0.000012–0.000013 USD) forms a weak support cluster. Only 312,850 addresses are holding SHIB in the next lower area. This means if SHIB breaks below 0.000012 USD, it could quickly drop to 0.000008 USD, as there are not enough buyers at lower levels to absorb the selling pressure.
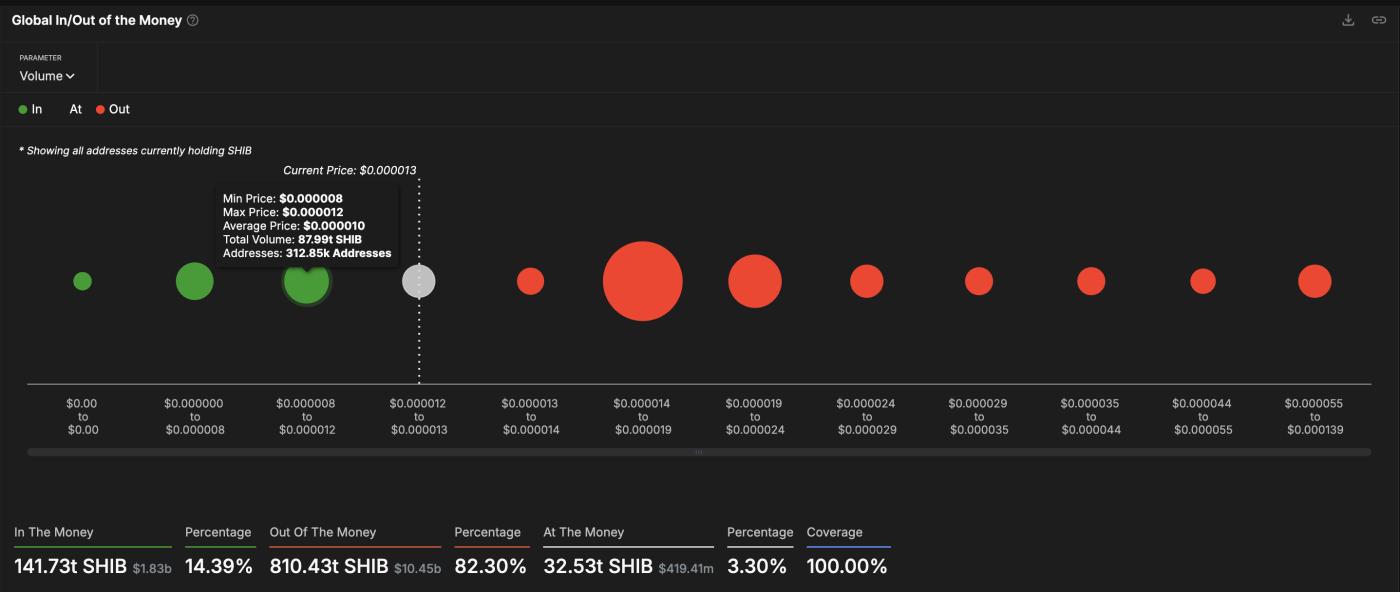 SHIB price and weak support levels: IntoTheBlock
The good news is that most investors are not in profit (and unlikely to sell at a loss), but this also means there is little buffer if the price drops.
Even small declines could trigger a significant drop due to weak on-chain support.
Bearish flag suggests Shiba Inu price decline
On the 2-day price chart, SHIB is forming a flag pattern that could break in either direction. But currently, the price is oscillating near the lower trend line of the flag around 0.00001158 USD, and a clear break below this level could signal a complete pattern breakdown. Shiba Inu price has attempted to recover several times from the lower trend line.
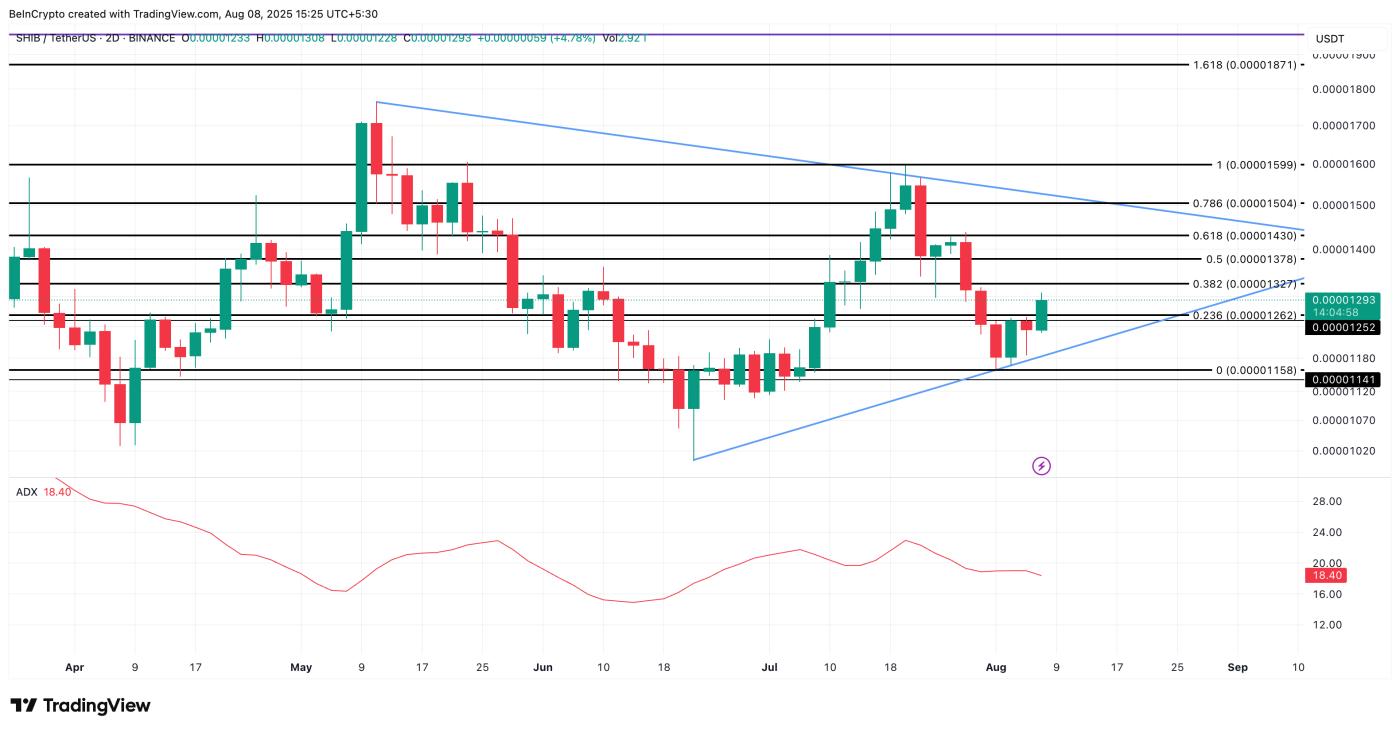 Shiba Inu price analysis: TradingView
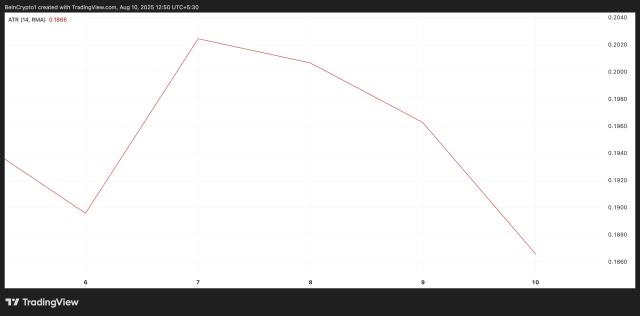
Additionally, the Average Directional Index (ADX) has weakened. It dropped from 22 (mid-July) to 18.4, indicating the overall trend strength is gradually decreasing. A declining ADX near the pattern support often means the price could drop without strong buying interest to prevent it.
The Average Directional Index (ADX) measures the strength of price trends; whether it's increasing or decreasing, and a declining ADX means the trend is weakening, not gaining momentum.
If SHIB loses support at 0.0000115 USD, it could drop deeper, which is also confirmed by the In-and-Out of money setup. On the other hand, to invalidate this bearish setup, SHIB needs to break above 0.0000132 USD and 0.0000137 USD first. However, the trend will turn bullish if it can break through the flag's resistance, specifically around 0.0000150 USD.