Written by: UkuriaOC, CryptoVizArt, glassnode
Translated by: AididiaoJP, Foresight News
Ethereum's price continues to strengthen, moving towards its historical high point, while Bitcoin consolidates below its peak. However, the surge in open interest for mainstream Altcoins, coupled with exceptionally low Bitcoin volatility expectations, has laid the groundwork for increased volatility in the digital asset market.
Summary
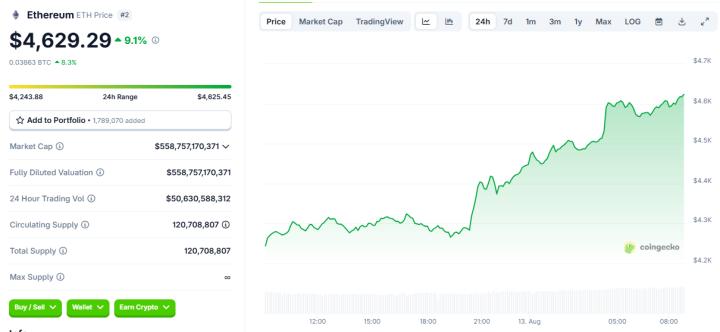
Ethereum's rally continues to accelerate, with its price reaching $4,600, the highest level since December 2021, approximately 5% below its previous all-time high. However, increasing speculative activity around this leading Altcoin has driven the total open interest for mainstream Altcoins to a record $47 billion. This leverage accumulation creates a more volatile market background, with price impacts becoming increasingly reflexive.
Bitcoin's key on-chain indicators continue to show strong momentum. Short-term holders' actual losses during the recent pullback to $112,000 were notably low, with the vast majority of investors still in a profitable state.
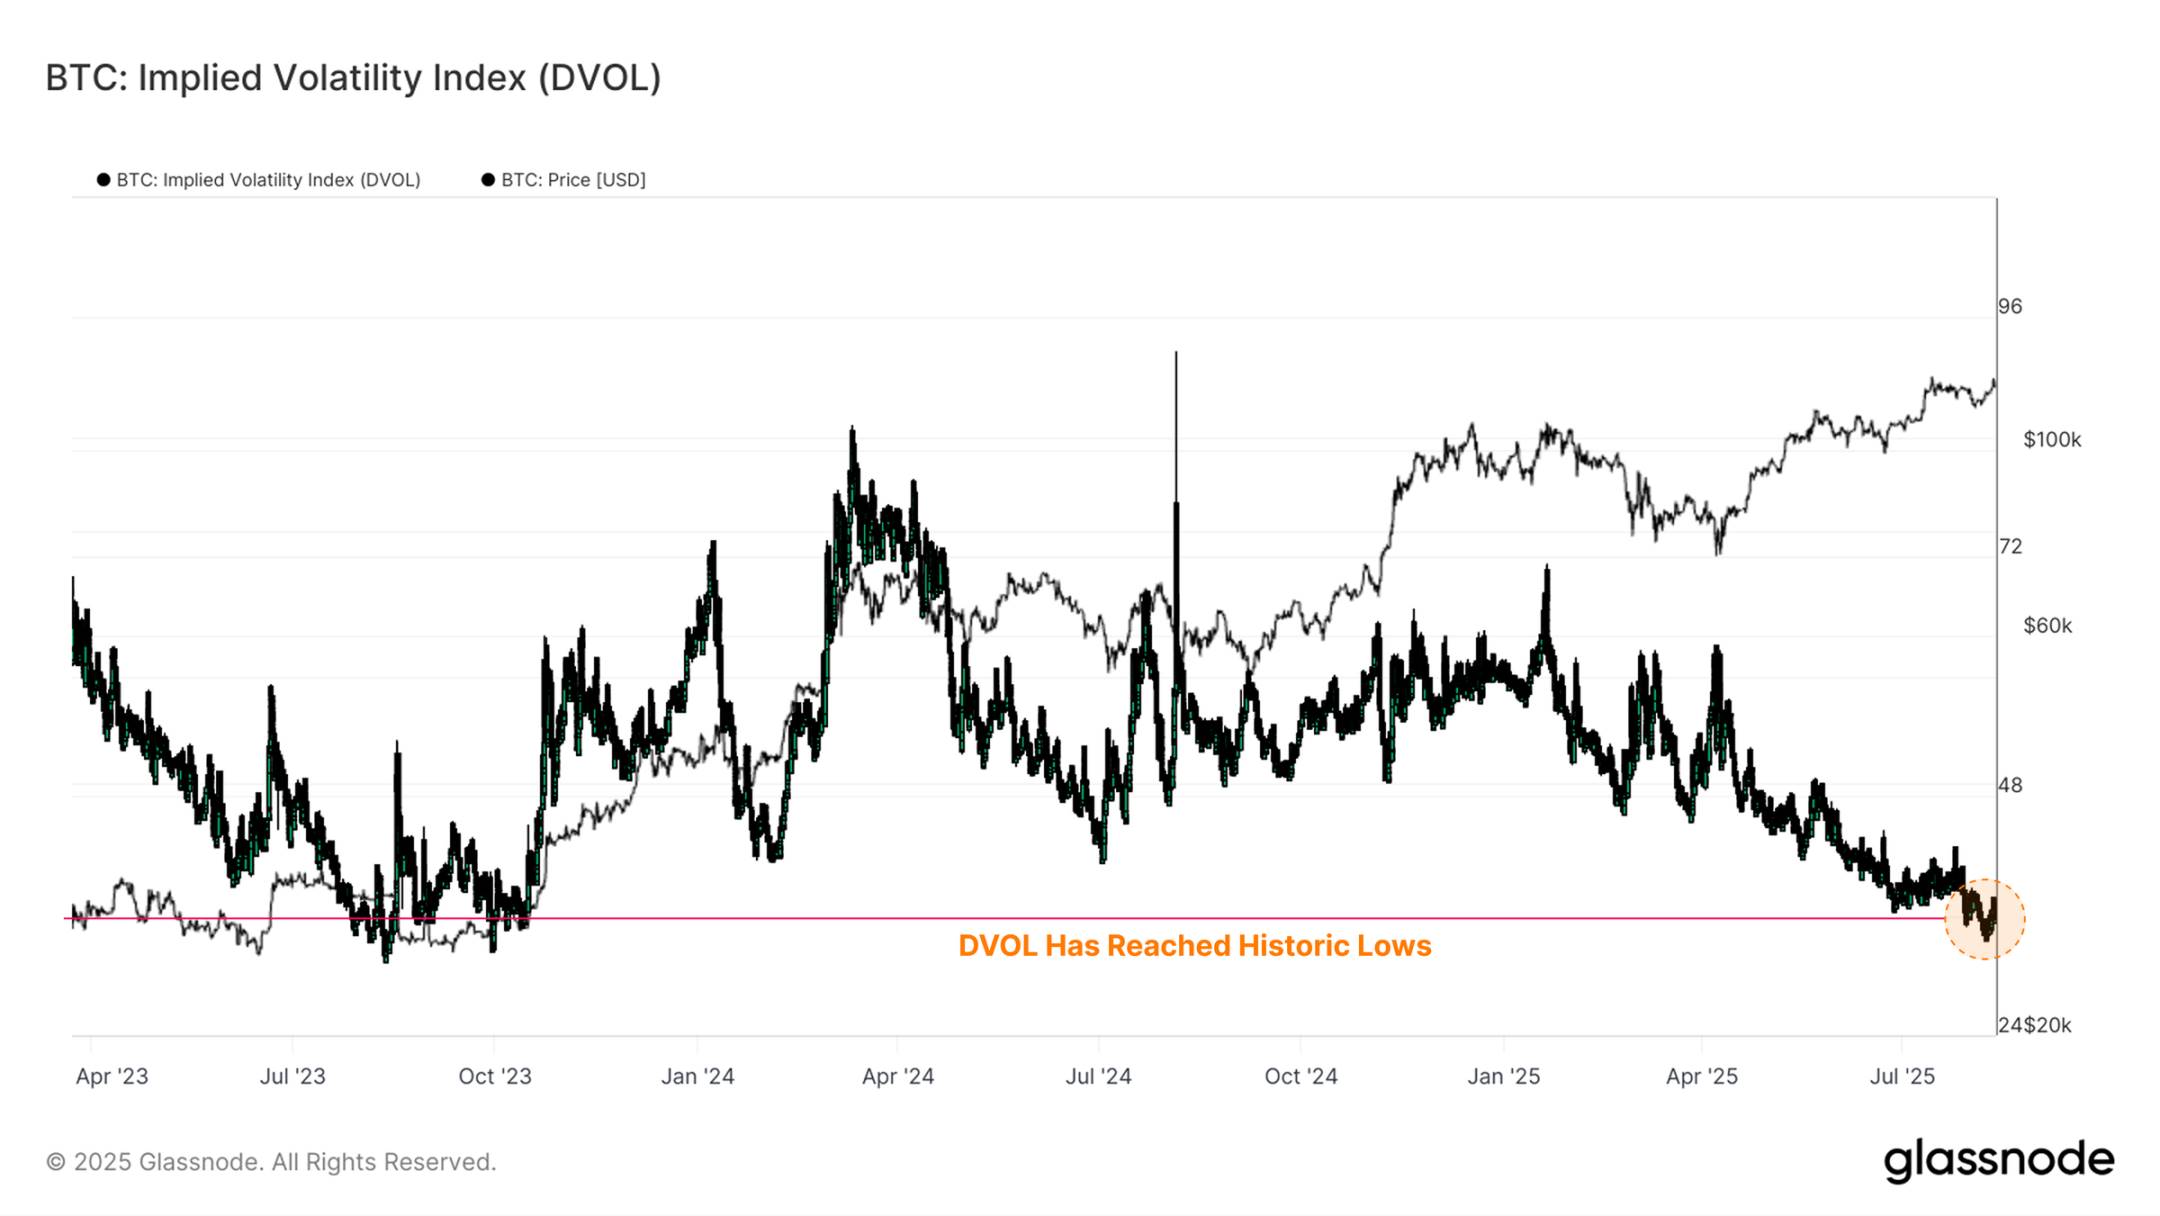
Options traders continue to bet on low volatility mechanisms, with at-the-money implied volatility (IV) at multi-year lows across all tenors. Historically, periods of abnormally low implied volatility often signal a sharp expansion of actual volatility, which can be viewed as a contrarian signal.
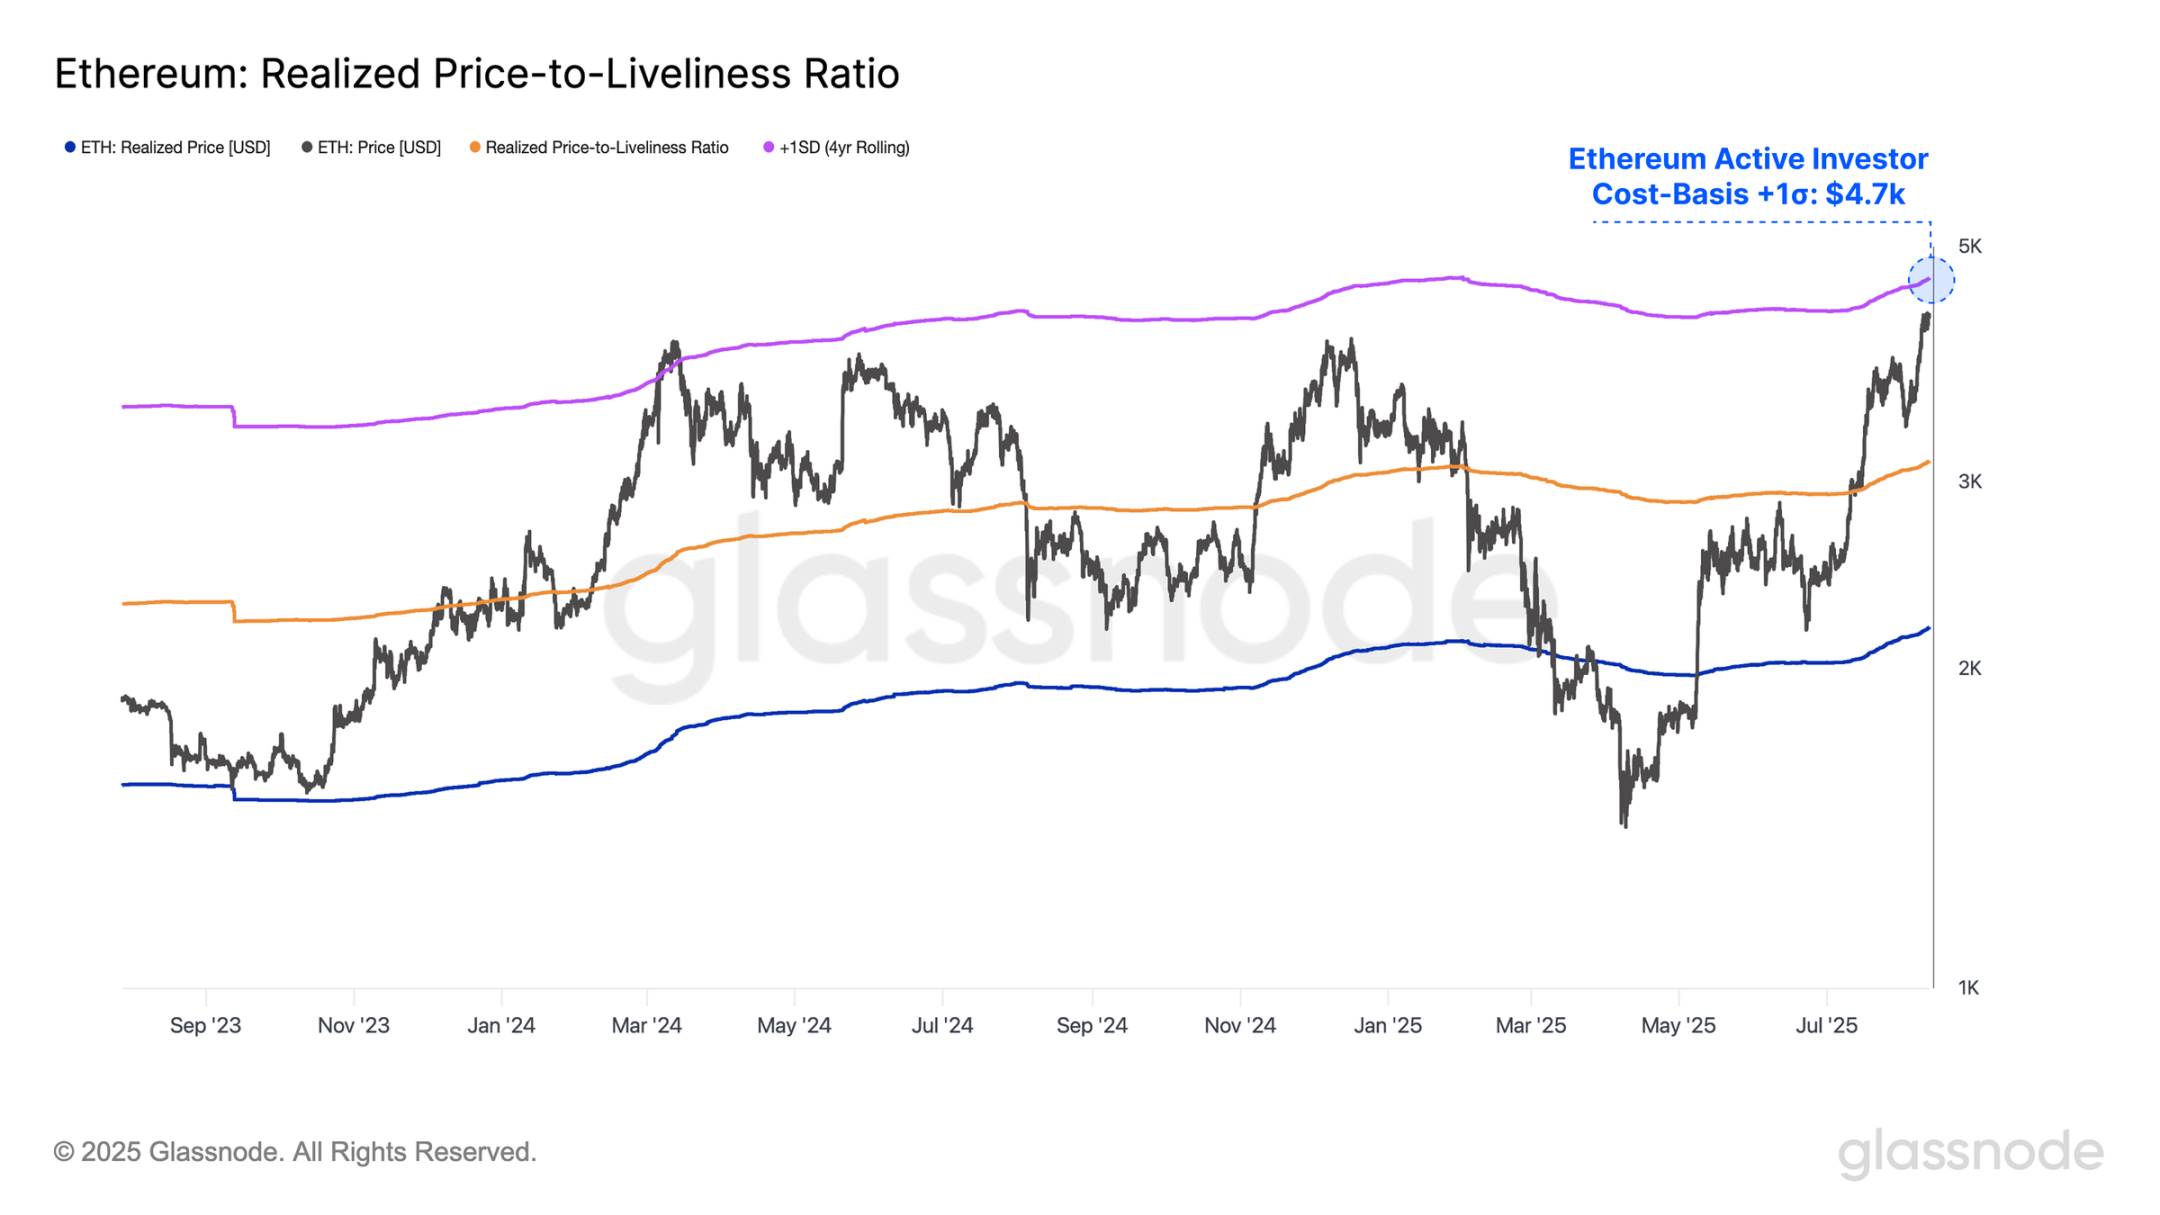
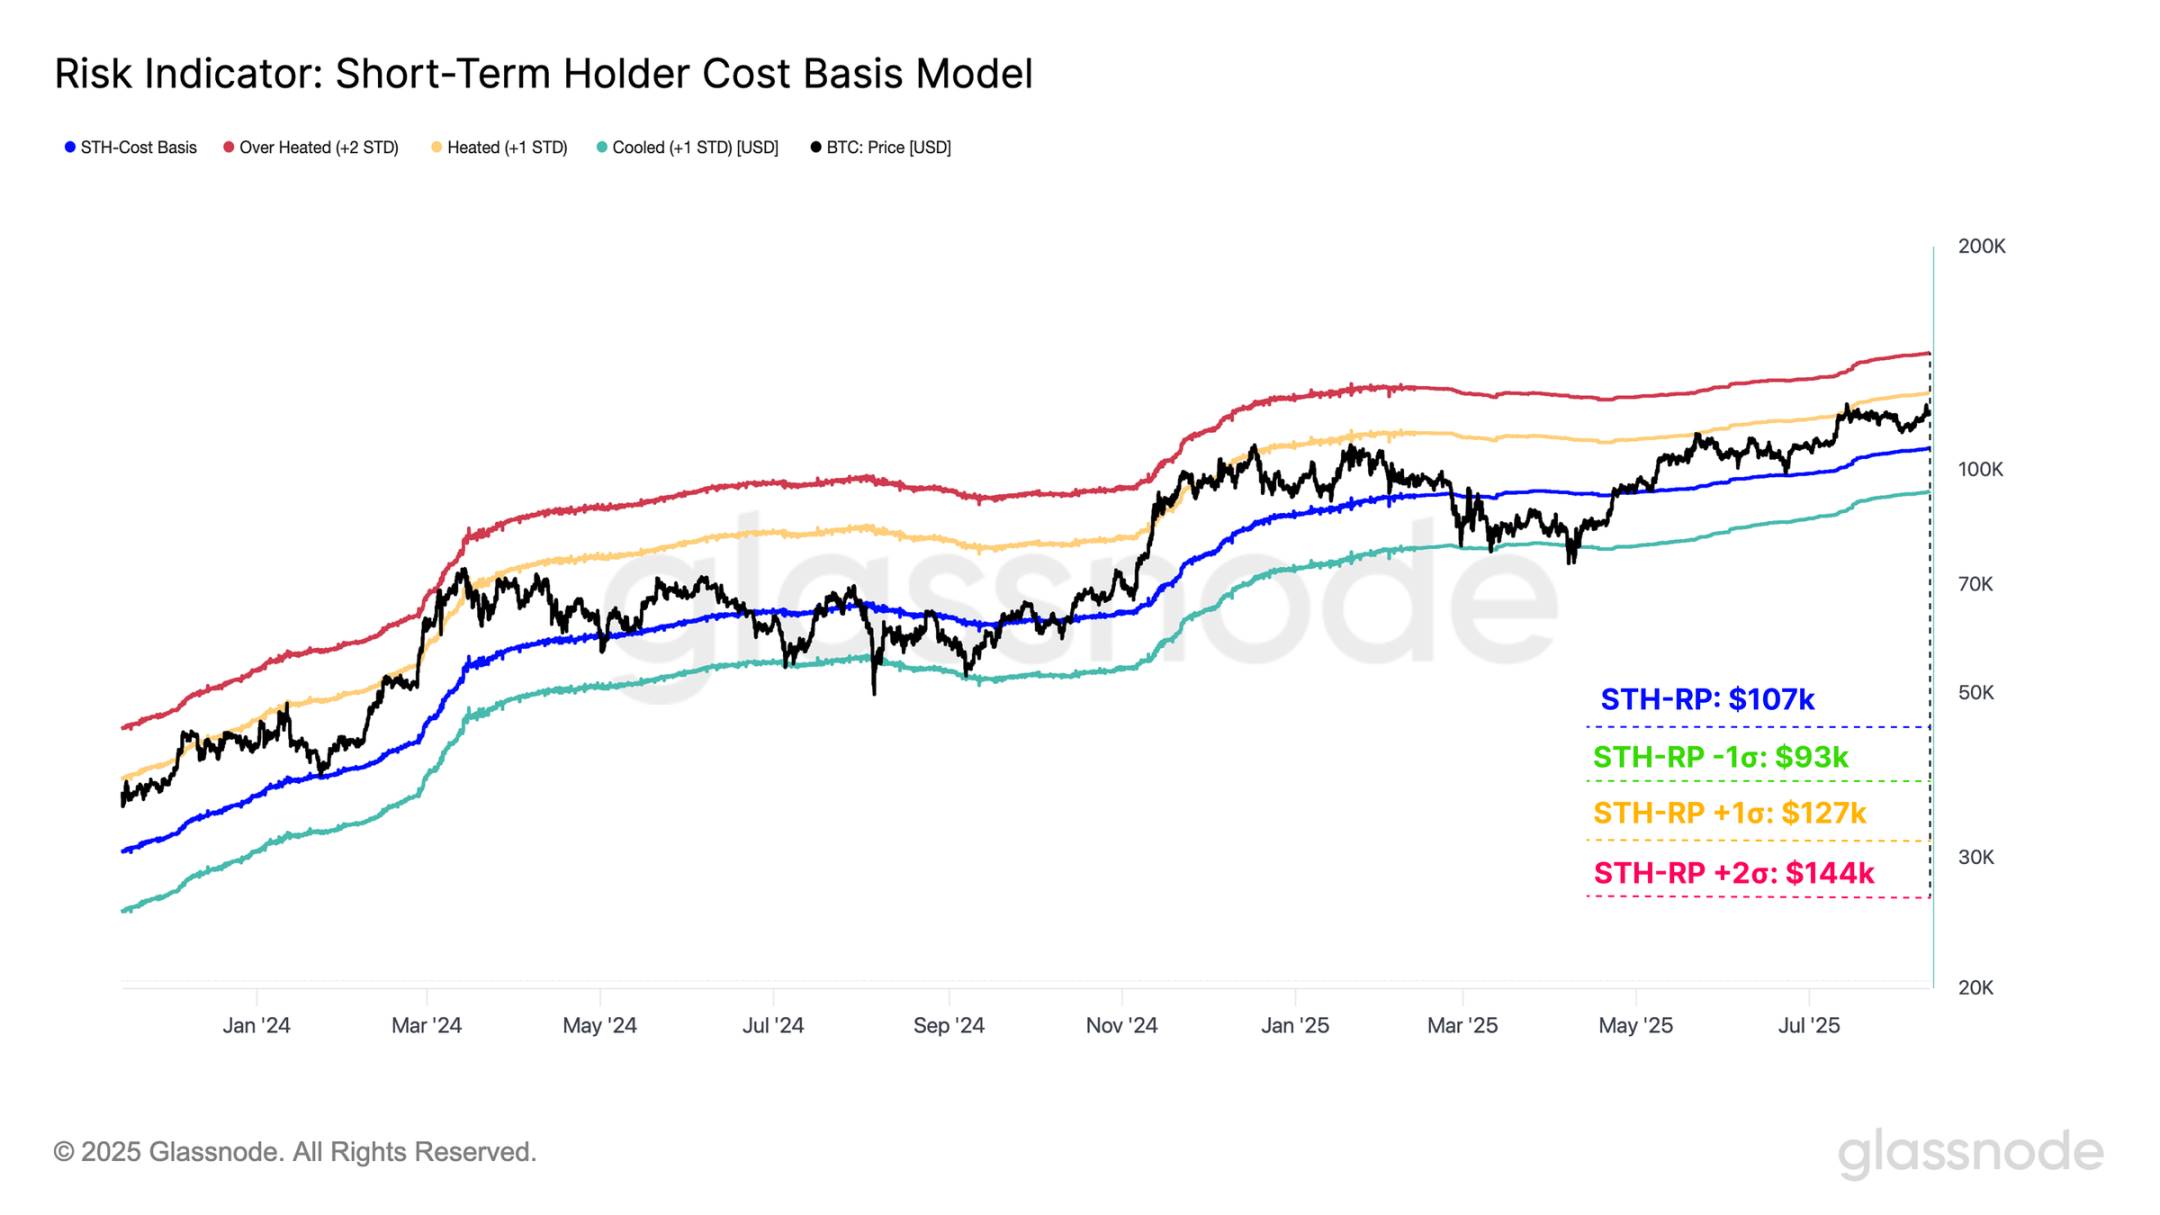
Ethereum is approaching its +1σ active realized price level of $4,700, an area that historically has triggered strong selling pressure. Meanwhile, Bitcoin is approaching its +1σ short-term holder cost basis of $127,000, which has been a cyclical resistance level. If Bitcoin can decisively break through this level, it may open a channel for further price increases to the +2σ level of $144,000.
Note: σ levels help traders identify historical price boundaries, with +1σ being a short-term key resistance level. If breached, it may challenge higher standard deviation levels (such as +2σ). Prices reaching +2σ typically indicate an overheated market (such as excessive investor leverage), requiring caution about pullback risks.
Altcoin Rise
The digital asset market's rally continues to accelerate, with Ethereum leading the way. Its price has risen from $1,500 in April to $4,300, the highest level since December 2021, only 5% below its historical high of $4,800. Historically, Ethereum has been a bellwether for broader Altcoin performance, and its recent strength is driving investors to speculate further along the risk curve.
[Images omitted]
This fund rotation is also reflected in the Bitcoin dominance metric, which measures Bitcoin's share of total digital asset market capitalization. Over the past two months, Bitcoin's dominance has dropped from 65% to 59%, highlighting funds moving towards higher-risk assets.
By observing the 7-day percentage changes of mainstream Altcoins (Ethereum, XRP, Solana, and Dogecoin), we can see strong gains during July and August:
Ethereum 7-day change: +25.5%
XRP 7-day change: +16.2%
Solana 7-day change: +13.6%
Dogecoin 7-day change: +25.5%
These gains indicate a comprehensive Altcoin rally as investor speculative activity intensifies.
[Remaining content continues in similar translated style]
Currently, the DVOL reading is at a historical low, with only 2.6% of trading days having values lower than the current level. This level typically reflects market complacency and insufficient hedging demand for significant volatility. Although this situation may persist, the market will be susceptible to sudden fluctuations if a catalyst emerges, as demonstrated by the violent and disorderly price movements when risks were rapidly repriced in past cycles.
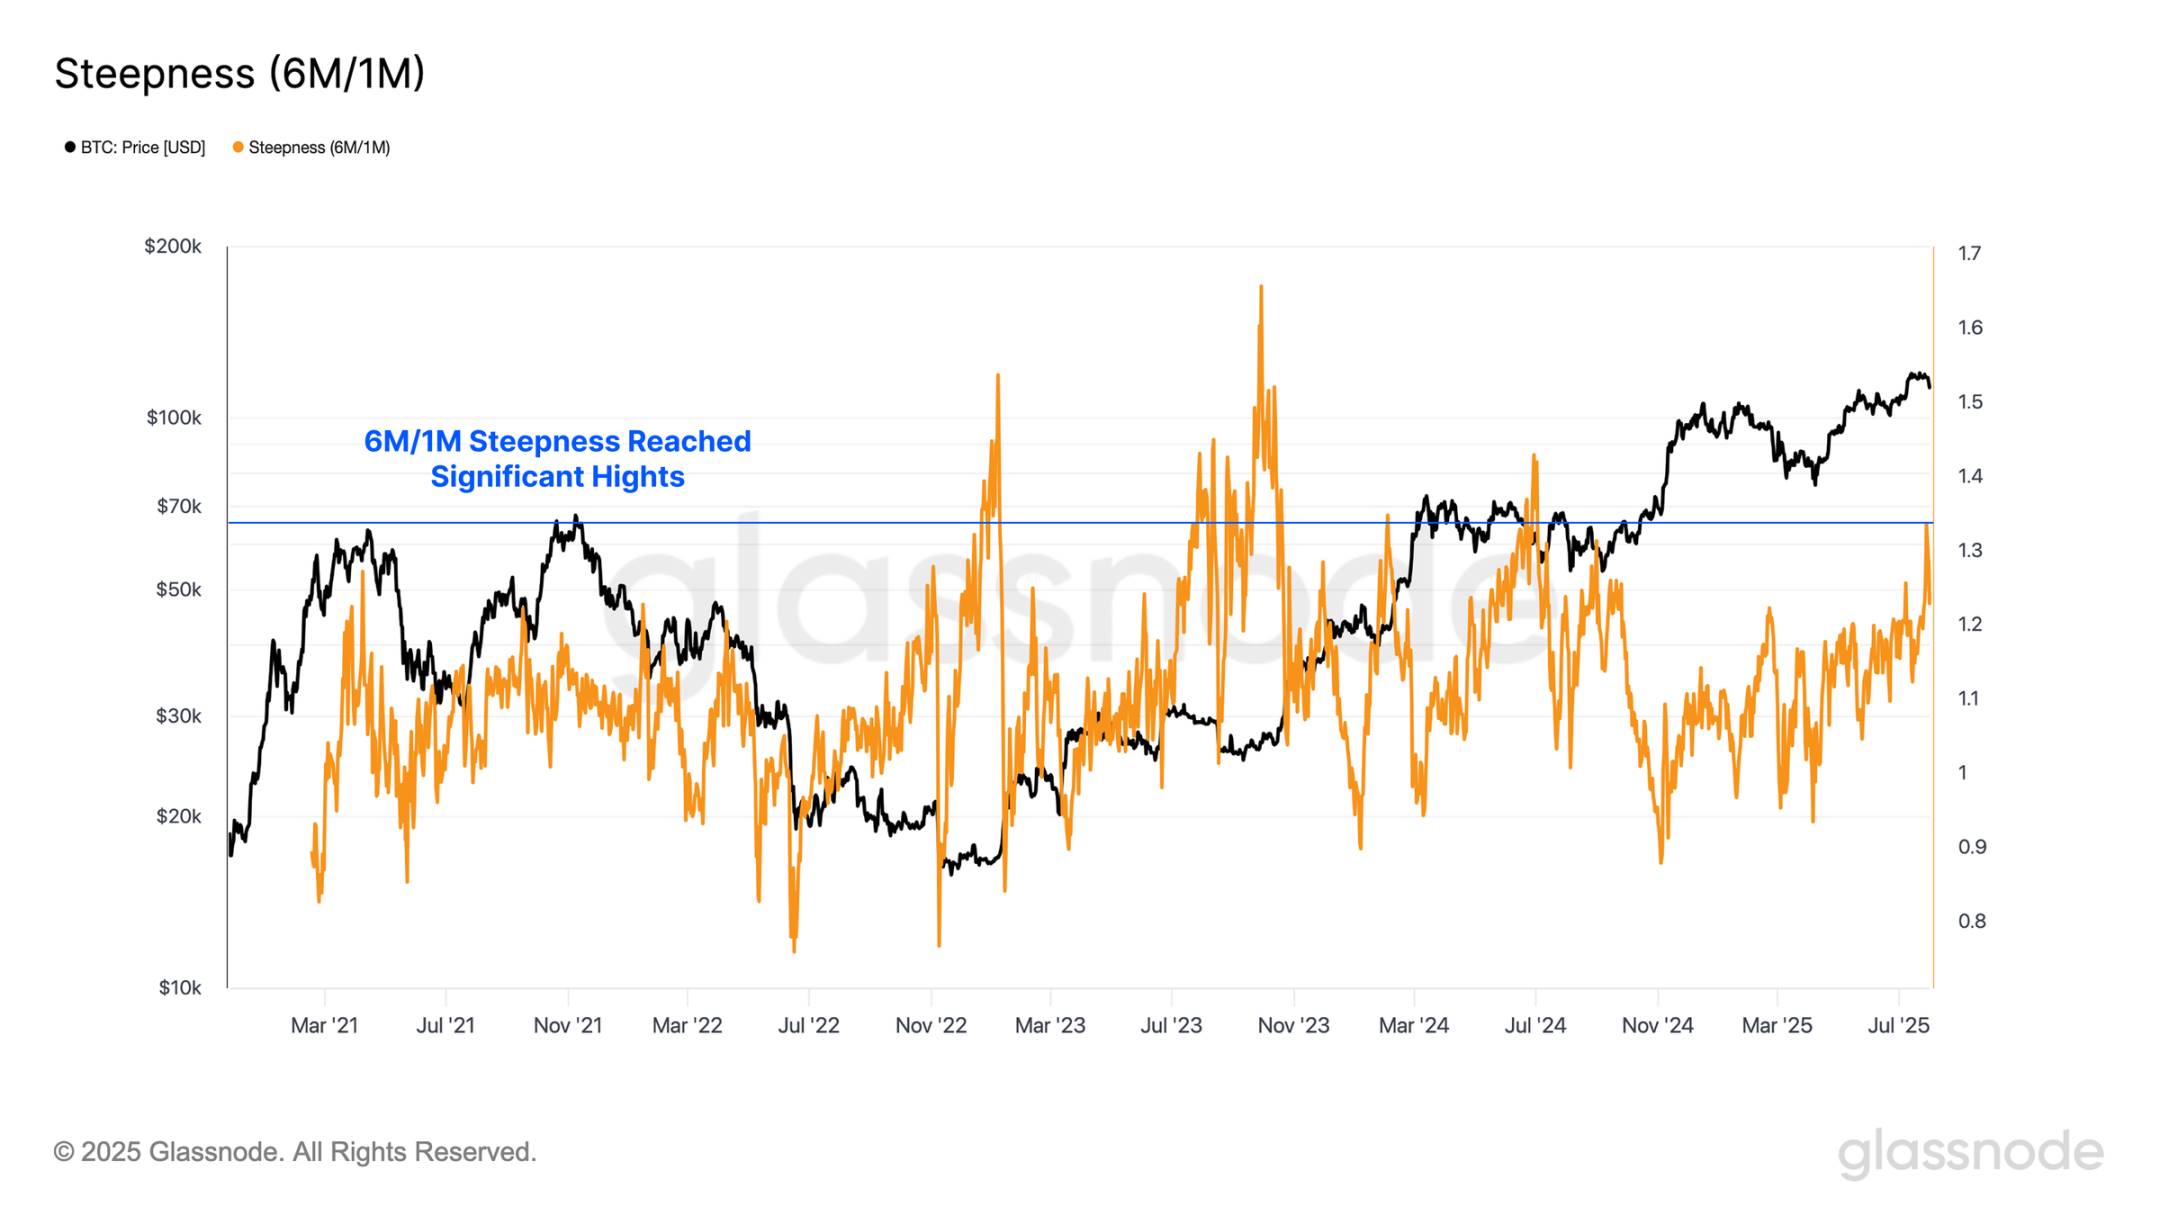
Additionally, we can track the 6-month/1-month implied volatility ratio to assess changes in market volatility expectations over time. Changes in this ratio can reveal whether traders believe risks are concentrated in the near or distant future, helping to identify sentiment shifts and the expected timing of market stress or exuberance.
Currently, the 6-month/1-month implied volatility ratio is at a high level, with only 3.2% of trading days having readings higher than the current level. This indicates that options traders perceive long-term uncertainty to be significantly higher than short-term, suggesting a substantial increase in volatility expectations for the next two quarters.
Market Navigation
To assess potential upside targets for Ethereum's current rally, a useful reference point is the +1 standard deviation level of its active realized price, which typically marks the beginning of selling pressure accumulation. Currently, this threshold is $4,700 and may represent an overheated area under current market conditions.
This level has historical significance, serving as a strong resistance level during the March 2024 rally and multiple times during the 2020-2021 bull market cycle. In the past, when Ethereum broke through this range, it was usually accompanied by heightened investor sentiment and a fragile market structure.
Given these dynamics, the $4,700 price point is a critical resistance level that requires close attention. A decisive breakthrough could signal the market entering a more speculative phase, but it could also increase the risk of a sharp pullback if sentiment reverses.
In contrast, for Bitcoin, we can evaluate the Short-Term Holder (STH) cost basis, which represents the average purchase price for new market participants. Historically, this key price level marks the boundary between local bull and bear markets. By applying standard deviation intervals, we can assess whether the market is overheated or overcooled.
From these pricing perspectives, $127,000 becomes a critical level to monitor closely. If the price continues to rise, the market's reaction to this level will be crucial. Moreover, if Bitcoin decisively breaks through $127,000, it may target the $144,000 area, where the +2σ interval converges with major resistance, potentially triggering a sharp increase in selling pressure.
Summary and Conclusion
The market is currently in a sensitive stage characterized by a contradiction between high speculation and low volatility, requiring caution about short-term market shifts. The digital asset market currently shows polarization: Ethereum is strongly rising, approaching historical highs and driving Altcoin rallies, but with open interest surging to $47 billion, indicating leverage accumulation and increased market fragility; Bitcoin is consolidating at high levels, with robust on-chain indicators, but options market implied volatility is at a multi-year low, suggesting potential for violent volatility.
The strong performance of digital assets continues, with Ethereum surging to $4,600, its highest level since December 2021, currently only 5% below its all-time high, while Bitcoin's momentum remains strongly supported by robust on-chain fundamentals.
The strong Altcoin price performance has driven a surge in open interest for mainstream Altcoins, reaching a record $47 billion, increasing the possibility of price volatility. In contrast, the Bitcoin options market remains priced for a low-volatility environment, with implied volatility at multi-year lows, a setup that historically often signals sudden volatility expansion.
The two major cryptocurrencies are currently approaching historically important resistance levels: Ethereum at the +1σ level of active realized price at $4,700, and Bitcoin at the +1σ level of Short-Term Holder cost basis at $127,000. Price developments near these thresholds will be critical in determining whether the market will progress towards higher cycle targets or face a sharp leverage-driven pullback.