

Ethereum has adjusted over 2% in the past 24 hours, temporarily dropping below $4,500 before recovering to trade above $4,600. This decline occurred against the backdrop of a broader cryptocurrency market slide, wiping out over $240 billion in value and triggering nearly $1 billion in liquidations.
However, despite strong selling pressure, Ethereum's technical and on-chain signals indicate that bulls are still dominant.
High Exchange Inflow Signals Selling Pressure
Ethereum saw 2,594,168 ETH transferred to exchanges on 14/08/2025, marking the second-highest daily exchange inflow of the year 2025, just after the 3,264,688 ETH spike on 03/02.
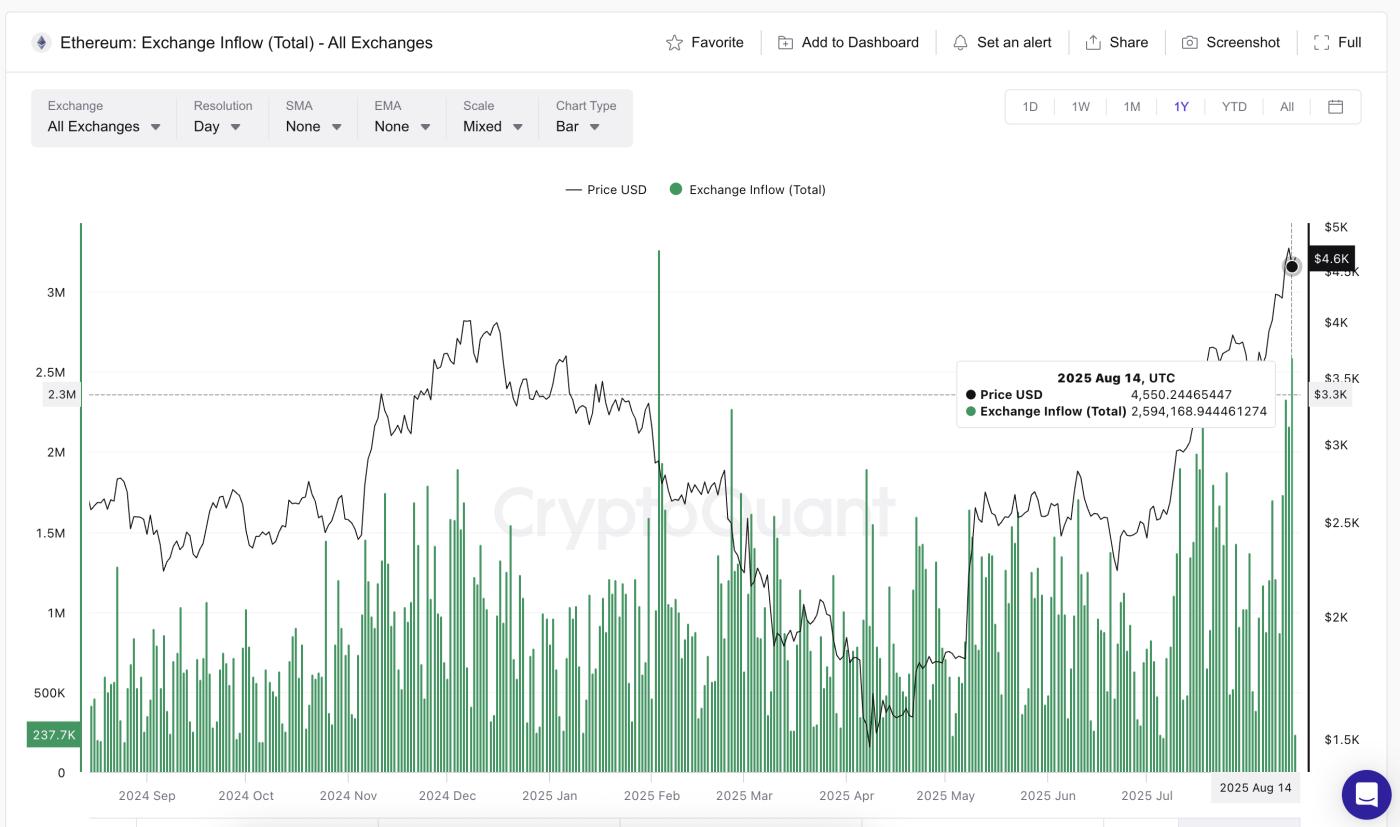 Ethereum Price and Inflow: Cryptoquant
Exchange inflows typically signal potential selling pressure, and this increase was partly driven by Ethereum Foundation wallets, the largest recent sellers.
Historically, local peaks with high inflows often lead to price corrections, as seen earlier in 2025. At that time, Ethereum's price was in a downtrend, and each local peak in exchange inflows led to a more significant decline.
Things were different as seen on 18/07 (2,381,361 ETH) and 12/08 (2,335,642 ETH), the current local peaks in inflows. Unlike the spikes during the February downtrend, recent inflows occurred in an uptrend, a context where selling pressure is being offset by strong buying. This buying absorption is currently crucial in maintaining Ethereum's price structure.
For token TA and market updates: Want more detailed information about tokens like this? Subscribe to the Daily Crypto Newsletter by Editor Harsh Notariya here.
Large Investor Inflows Show Supply Absorption
Supporting this absorption story, inflows from large investors – addresses holding at least 0.1% of ETH's total supply – remain strong. Despite a slight decrease on 13/08, the seven-day change is +98.71%, and the 90-day change has increased by +255.27%. These wallets are known for strong accumulation during price dips.
 Ethereum Price and Large Investor Inflows: IntoTheBlock
For example, from 31/07 to 01/08, when ETH price dropped from $3,781 to $3,577, large investor inflows increased from 240,190 ETH to 687,290 ETH.
Even after short-term declines, these inflows continue to reach higher levels on the monthly chart. The figure reached 725,000 ETH on 13/08 before stabilizing above 617,000 ETH. This indicates that deep-pocketed buyers are still building positions.
Exchange inflows track coins moving to exchanges, often signaling potential selling. Conversely, large investor inflows measure accumulation by wallets holding at least 0.1% of total supply. This is a measure of buying pressure from large investors.
Ethereum Price Structure Remains Intact as Buyers Control
Technically, Ethereum's price remains in an uptrend, with the $4,480 area serving as strong support during the recent decline. Immediate resistance is at $4,785, an important Fibonacci extension. A daily close above this level could open a move towards the psychological $5,000 level, precisely $5,175.
 Ethereum Price Analysis: TradingView
The bull-bear strength indicator continues to support buyers, showing that despite large exchange inflows, bears have not yet gained control.
To invalidate the bullish hypothesis, a decisive break (complete candle) below $4,480 is needed. This would require a sustained increase in ETH exchange inflows and a decrease in large investor inflows over 30 days – conditions not yet met.


