The price of Zcash has not shown a clear trend in the past few weeks, despite increasing by over 600% in the last 3 months. The Token is currently trading sideways while many other areas of the crypto market are attempting a slight recovery.
The recent surge in interest stems from a prominent figure in the crypto market. In a recent interview, Arthur Hayes gave a positive assessment of Zcash's design.
However, ZEC 's price movement shows hesitation, even though the Token recorded a slight increase of nearly 4% on the day. Now, traders are considering whether this support is truly important in the short term or whether the chart will decide first.
What did Arthur Hayes say about the privacy model?
Arthur Hayes is the co-founder of BitMEX and a prominent figure in the crypto world. In a recent conversation with Kyle Chasse, Hayes Chia why his views on privacy coins have changed over time.
He stated that Monero was previously XEM the most robust privacy option, but new data and upgrades have made him reconsider. Hayes emphasized that Zcash has made significant progress, especially in shielded transactions and Cryptology improvements.
"That's one of the reasons I switched from the Monero group to the Zcash group when it came to privacy coins," he Chia at the 30-minute mark of the interview.
The key here is context. Hayes didn't discuss a price target for Zcash . Nor did he suggest that people should rush to buy. His comments focused solely on technology and design, not market timing.
This difference explains why the price of Zcash has not yet shown a clear reaction.
Why hasn't the Zcash price changed yet?
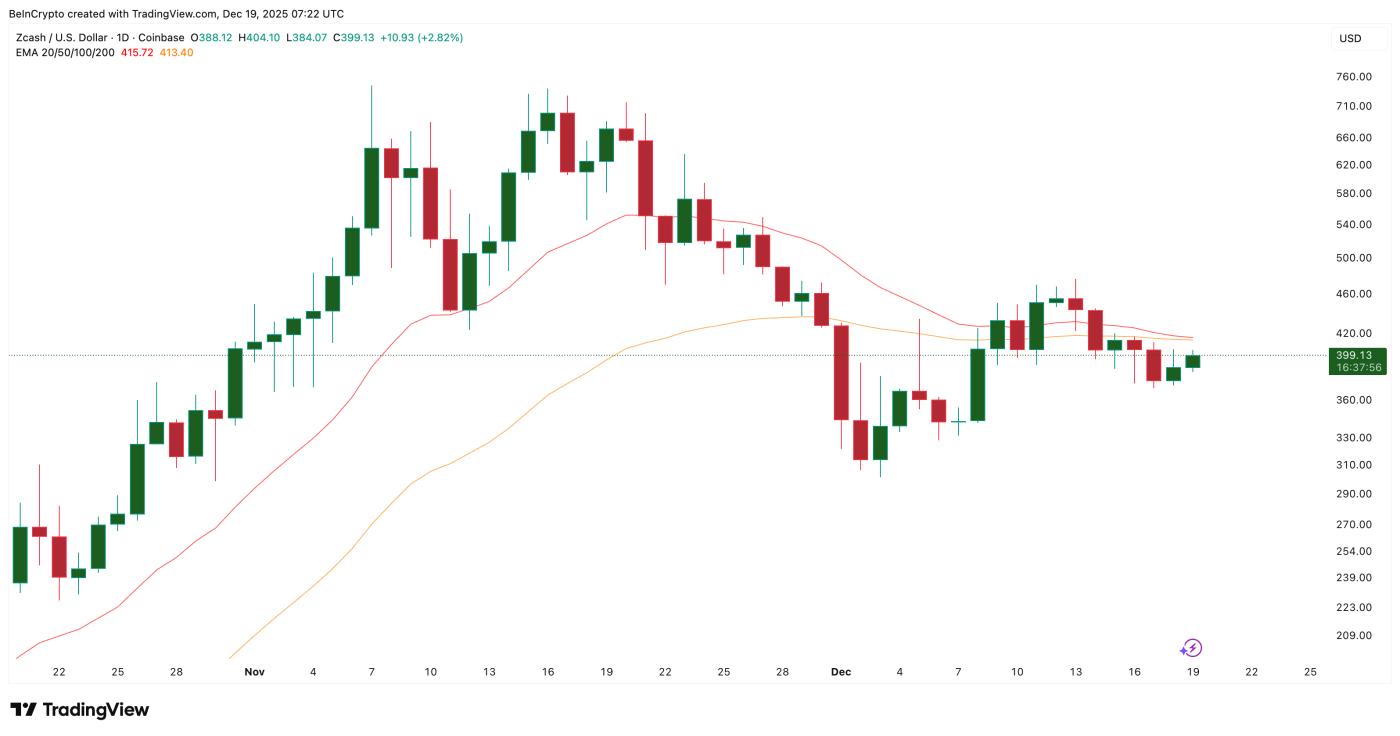
Despite receiving attention from Arthur Hayes, the price of Zcash has not fluctuated much. The reason is immediately apparent in the technical analysis chart.
First, there's the EMA crossover, indicating a downtrend is forming. The EMA is an exponential moving Medium , which focuses more on recent price movements.
When the 20-day EMA crosses below the 50-day EMA, it usually indicates that short-term sellers are stronger than buyers. Currently, the 20-day EMA is very close to crossing below the 50-day EMA. Therefore, traders remain cautious.
Want to Also Read Token analysis? Sign up for the daily Crypto newsletter from editor Harsh Notariya here .
 A bearish crossover has appeared: TradingView
Furthermore, the On-balance Volume(OBV) indicator also failed to support the price. OBV shows the flow of money into or out of the market. From December 12th to 18th, the price of Zcash decreased slightly, and the OBV also weakened. This means that buyers were not yet actively buying. If the OBV does not increase, price rebounds often fail, while price declines tend to continue.
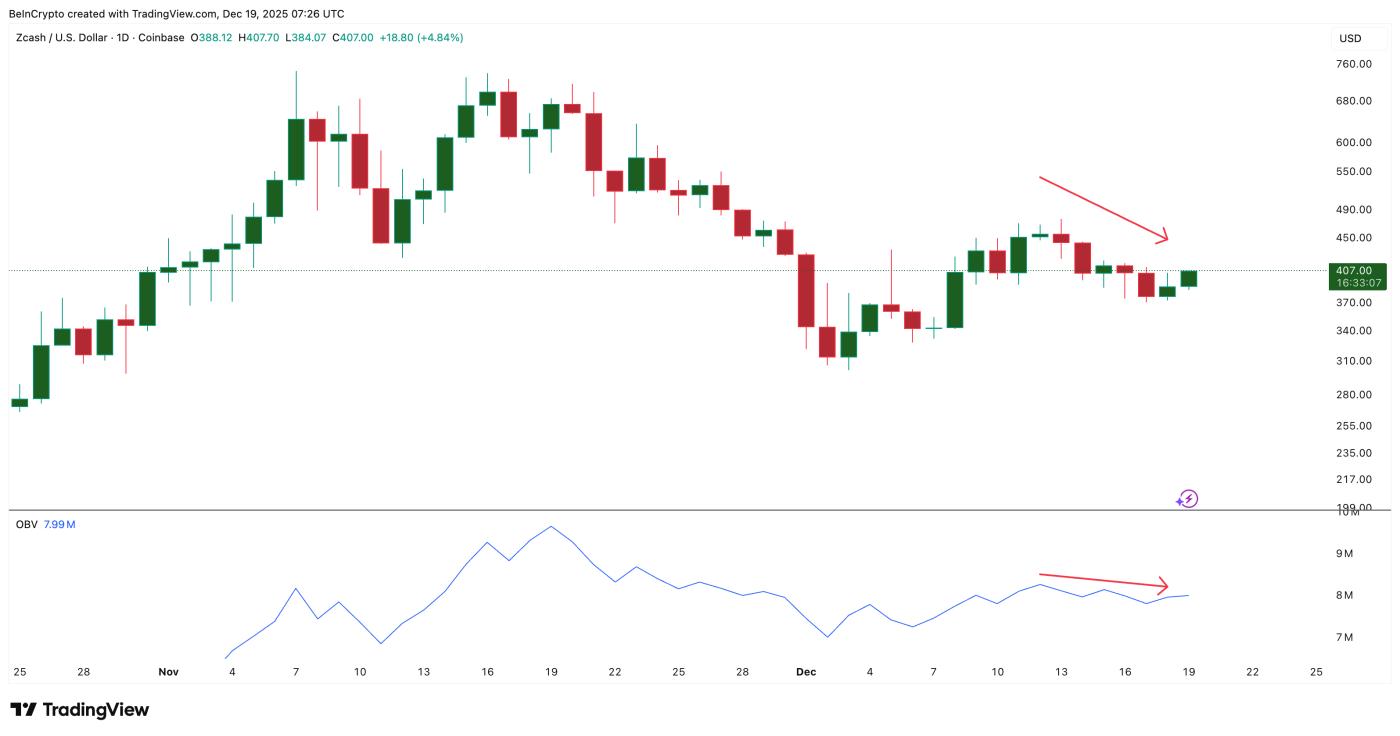 Volume is not yet supporting the price: TradingView
Taken together, the current picture is quite clear. The EMA crossover signals short-term downward pressure. The OBV shows weak buying pressure. That's why the price of Zcash is still fluctuating, waiting for a clear direction.
Arthur Hayes' comments helped reinforce long-term confidence, but technical charts suggest traders are still waiting for further confirmation. Until buyers actually inject more capital, the price will continue to be uncertain about its direction.
What could determine the next Zcash price fluctuation?
The strong cash flow is the clearest indicator. The CMF (Chaikin Money Flow) indicator rose from December 11th to December 18th, even though the ZEC price corrected. This pattern suggests that large investors are still paying attention despite the weak price.
However, the CMF line remains below zero. This is important because when the indicator crosses above zero, it usually confirms actual buying pressure. For example, in previous instances, such as at the beginning of November, the price rose sharply after the CMF crossed above this level.
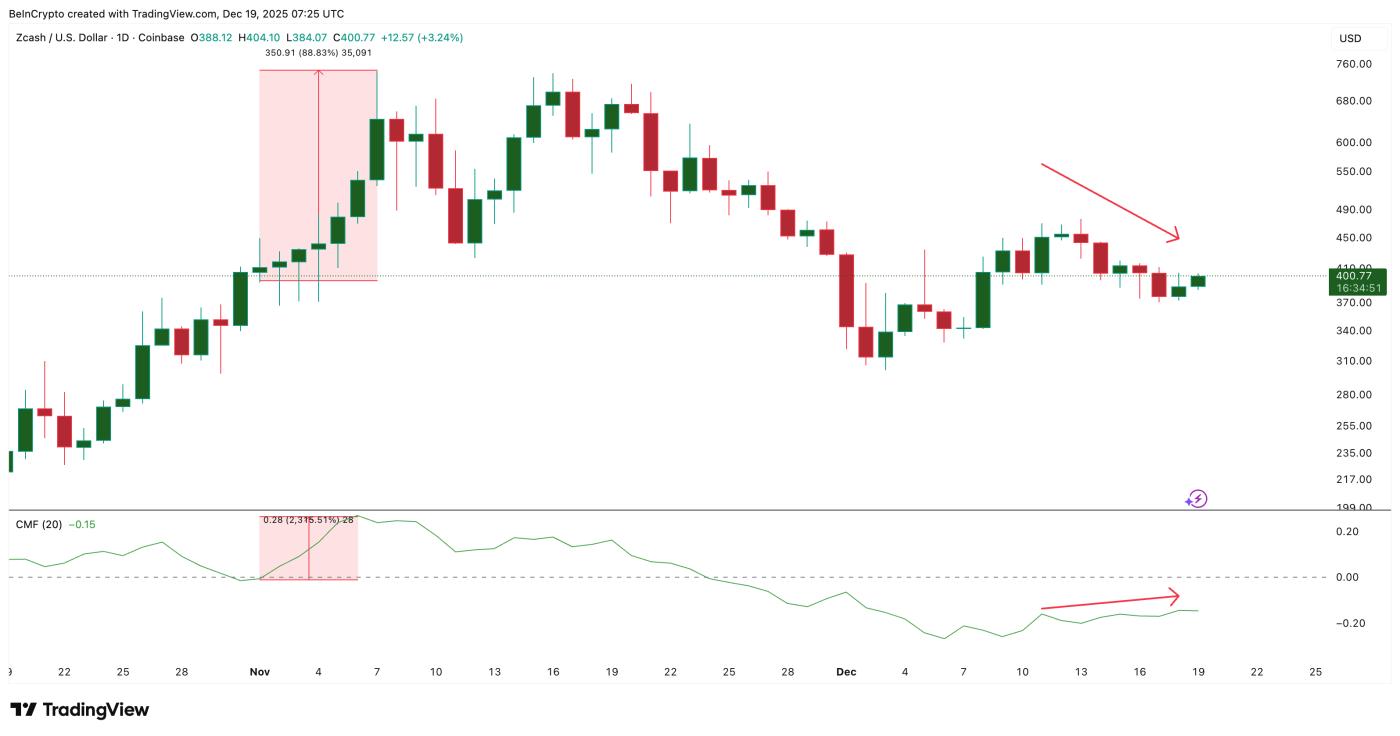 ZEC 's CMF indicator is rising: TradingView
With Zcash, key price levels have been clearly defined. A daily close above $434 would indicate buyers regaining control. If this happens, the next resistance zone would be around $516.
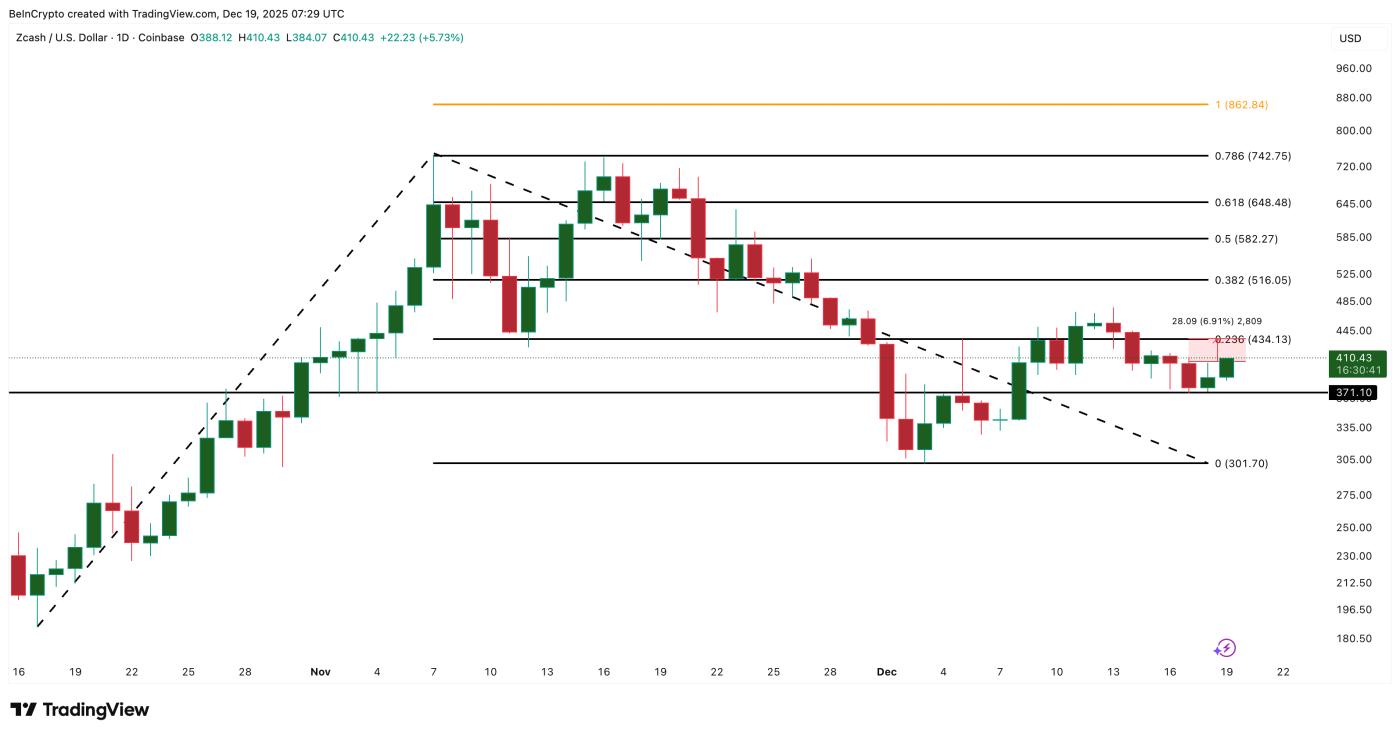 Zcash price analysis: TradingView
On the downside, the $371 level is the first support level. If the price falls below this level, selling pressure could increase and push the price back to the $301 region, where buying pressure has previously been observed.